Drone photogrammetry step by step: from flight plan to orthomosaic
A field-tested guide to UAV photogrammetry, from flight planning and ground control to processing an orthomosaic, DSM, and point cloud, drawn from my survey work at IIT Roorkee.

Drone photogrammetry, start to finish
Drone photogrammetry turns a set of overlapping aerial photos into measurable products: an orthomosaic, a digital surface model (DSM), and a 3D point cloud. The workflow has five main stages, plan the flight, set ground control, fly with enough overlap, process the imagery, and check accuracy. Done carefully, you get survey-grade maps with centimetre-level positioning. Done carelessly, you get a pretty picture you cannot trust for measurement.
I work on UAV photogrammetry as a research intern at IIT Roorkee, where my job involves both the flights and the GNSS ground control that ties the imagery to real-world coordinates. This post walks through the process the way I actually run it in the field, in India, with the tools I use day to day.
What is photogrammetry, in one line
Photogrammetry is the science of taking measurements from photographs. When a drone captures the same patch of ground from many overlapping angles, software matches common points across those images and reconstructs the geometry of both the camera and the terrain. That reconstruction is what gives you a map you can measure on.
The key word is overlap. Without it, the matching fails. With it, the rest of the pipeline becomes reliable.
Step 1: Plan the flight
Good output starts before the drone leaves the ground. A flight plan is built around the question you are trying to answer.
- Define the area of interest (AOI). Draw the polygon you actually need, plus a small buffer so the edges are well covered.
- Set the ground sampling distance (GSD). GSD is the real-world size of one pixel. A lower flying height gives a smaller GSD and finer detail, but more images and longer flights. Match the GSD to your purpose, a topographic survey needs finer detail than a broad land-cover map.
- Choose flight height and camera angle. Nadir (straight down) suits flat terrain and orthomosaics. For tall structures or steep relief, oblique passes help reconstruct vertical surfaces.
- Check the site and the rules. Wind, light, obstacles, and airspace permissions all matter. In India, follow the DGCA drone rules and fly within permitted zones.
I plan most missions in a ground-control app that generates an automated grid pattern over the AOI, so the drone flies parallel lines at a fixed height and triggers the camera at set intervals.
Step 2: Set ground control points (GCPs)
This is the step that separates a hobby map from a survey product, and it is the part I spend the most time on at IIT Roorkee.
A GCP is a clearly visible, well-distributed marker on the ground whose exact coordinates you measure with a GNSS receiver. During processing, you tell the software where each marker sits in the images and what its true coordinates are. The reconstruction is then anchored to those points, which corrects positional drift and improves both horizontal and vertical accuracy.
A few field habits that pay off:
- Spread GCPs across the whole AOI, including the corners and at least one near the centre. Clustering them in one area leaves the rest of the model weakly constrained.
- Use high-contrast targets that are easy to identify in the imagery.
- Measure with precise GNSS. I use an Emlid Reach RS3 and a Trimble DA receiver for the ground control, working in RTK so each point gets a tight, repeatable fix.
- Keep some points as checkpoints. Reserve a few measured points that you do not feed into the adjustment, then use them afterward to honestly report accuracy.
GCPs are also where the GNSS and photogrammetry sides of my work meet. The flight gives you geometry, the ground control gives that geometry a trustworthy coordinate system.
Step 3: Fly the mission with the right overlap
When you fly, the single most important setting is image overlap, expressed as front overlap (along the flight line) and side overlap (between lines).
- A common starting point is roughly 75 to 80 percent front overlap and 60 to 70 percent side overlap.
- Increase overlap over vegetation, water, sand, or uniform surfaces, where matching is harder, and over tall or complex structures.
- Keep speed and trigger interval consistent so spacing between photos stays even.
Fly in stable light and low wind where you can. Harsh shadows and motion blur both hurt the feature matching later. The drone follows the planned grid, holds its height, and captures hundreds of geotagged images across the AOI.
Step 4: Process the imagery
Now the images go into photogrammetry software. The processing chain is broadly the same across packages, even if the menus differ.
- Align images / build sparse cloud. The software detects features, matches them across overlapping photos, and solves for camera positions. This is the aerial triangulation step.
- Import and mark GCPs. You locate each GCP target in the images and assign its measured coordinates, then re-optimise. This is where the model snaps onto your real-world reference.
- Build the dense point cloud. A much denser 3D reconstruction of the surface, millions of points carrying position and colour.
- Build the mesh and DSM. The digital surface model is a raster of elevation values across the AOI, including everything on the surface, buildings, canopy, and terrain.
- Build the orthomosaic. Every image is geometrically corrected to remove perspective and relief distortion, then stitched into a single seamless, measurable map. On an orthomosaic, distances and areas are true to scale.
The three headline products, orthomosaic, DSM, and dense point cloud, then export cleanly into GIS. I bring them into QGIS and ArcGIS Pro for measurement, overlay, and any further analysis.
Step 5: Check accuracy before you trust it
A map is only as good as its reported accuracy. After processing, I compare the model against the checkpoints held back in Step 2 and review the GCP residuals the software reports. If the errors are within the tolerance the project needs, the deliverables are sound. If not, the usual culprits are weak GCP distribution, poor overlap, or a mislabelled control point, all fixable once you know where to look.
Quick recap of the workflow
- Plan: define the AOI, set GSD, height, and flight pattern.
- Control: place well-spread GCPs and measure them with precise GNSS (Emlid Reach RS3, Trimble DA).
- Fly: capture with high front and side overlap in stable conditions.
- Process: align images, mark GCPs, build the dense cloud, DSM, and orthomosaic.
- Verify: check against independent checkpoints and report the accuracy.
Where this fits in geospatial work
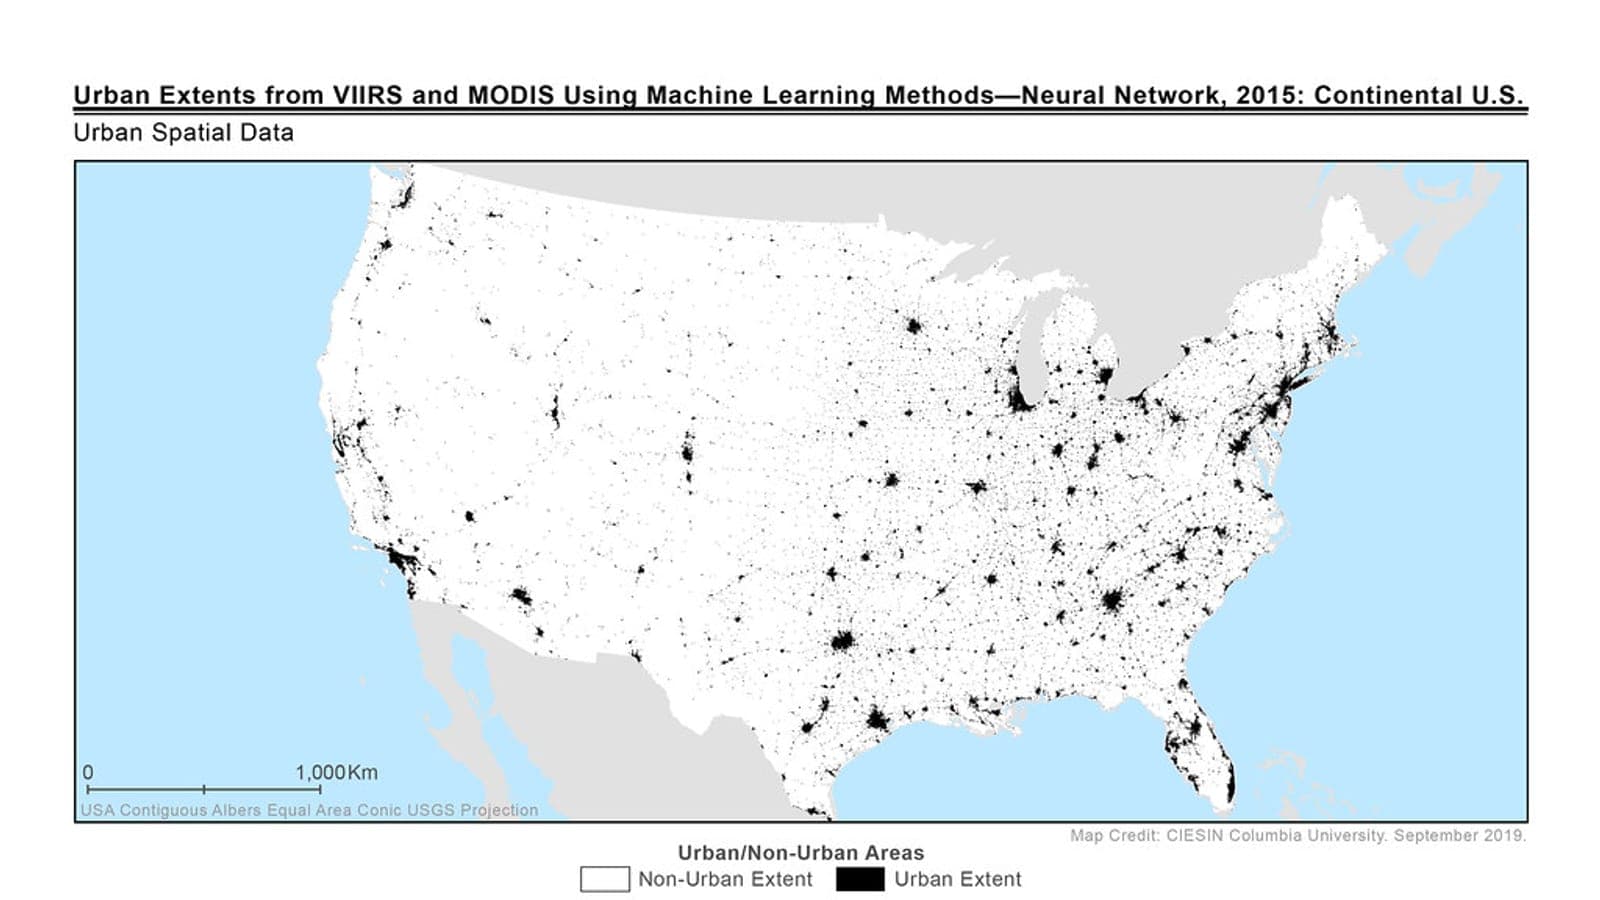
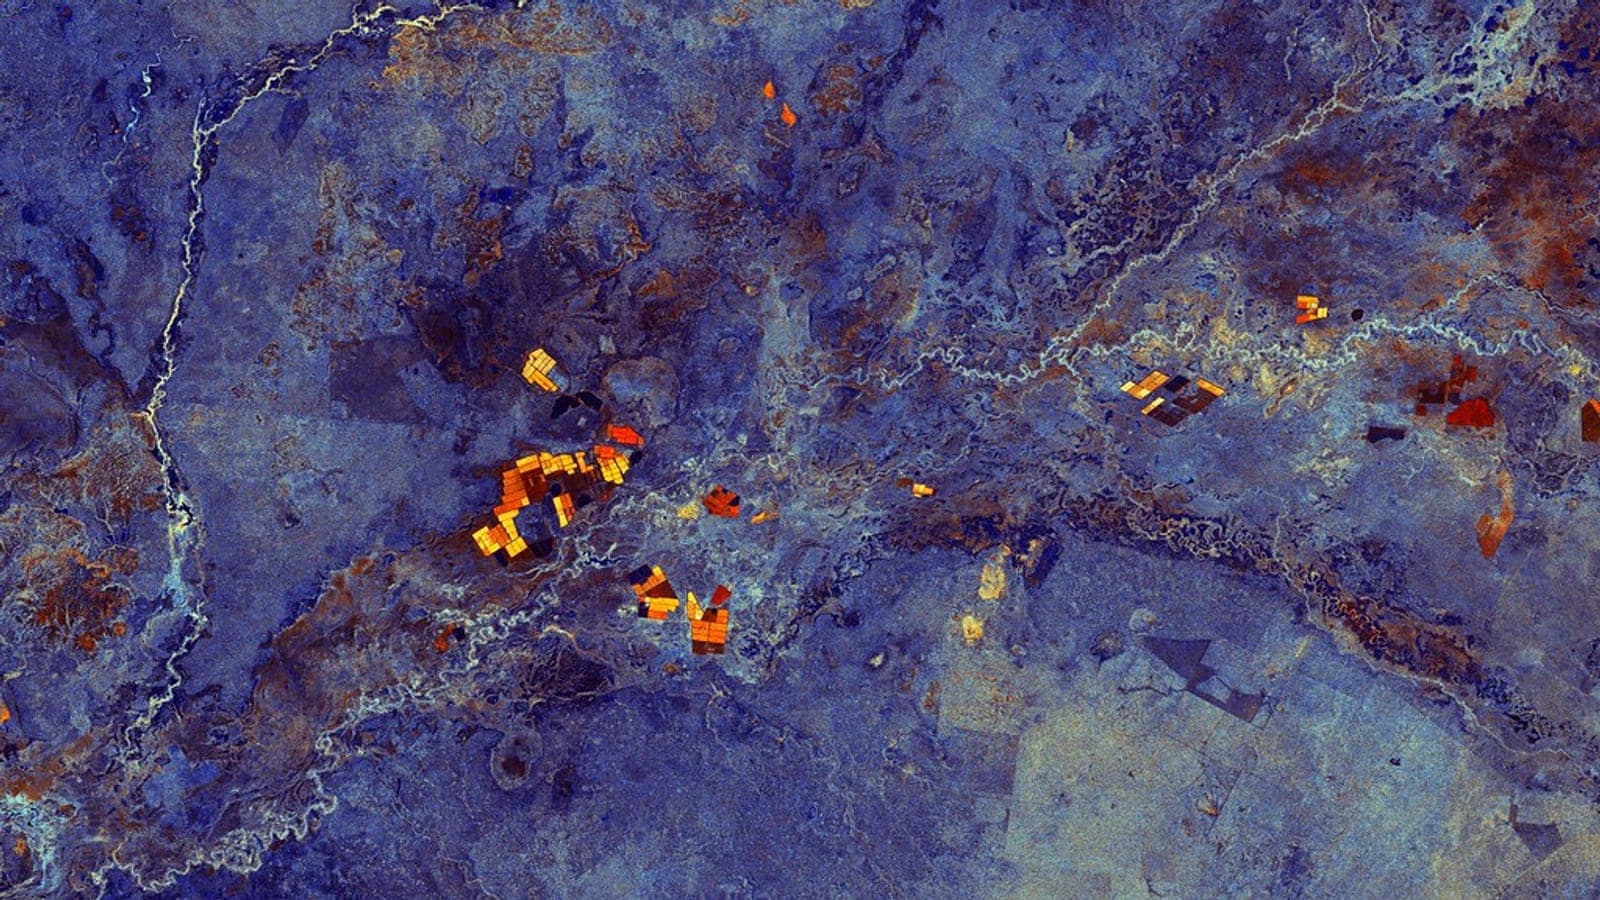
UAV photogrammetry sits nicely alongside satellite-based remote sensing. Sentinel-2 and Landsat give me broad, repeated coverage for indices and change detection, the kind of analysis I do for water and land studies across Punjab and Delhi NCT. Drones fill the gap where I need centimetre detail and fresh, on-demand imagery for a specific site.
If you are starting out, my advice is simple: respect the overlap, take ground control seriously, and always check your accuracy before you call the map finished. The flight is the fun part, but the GCPs and the verification are what make the result something you can actually stand behind.