NDVI Thresholds for Land Cover Classification: What the Numbers Mean
Fixed NDVI thresholds borrowed from global studies routinely misclassify Indian land cover because soil background, monsoon phenology, and sensor differences each shift values by 0.1–0.2 or more. This article explains what NDVI actually encodes and how to build a more defensible classification workflow for India's ecologically diverse landscapes.
Why Copying Global NDVI Thresholds Into Your Indian Study Is a Problem
If you have spent any time classifying land cover in India using NDVI, you have probably encountered a version of this situation: you apply a threshold you found in a paper, say, NDVI > 0.6 for dense vegetation, and your output looks wrong. Sparse scrubland in Rajasthan gets labelled as forest. Paddy fields at transplanting stage get lumped with bare soil. The map passes a visual check but fails the moment a domain expert looks at it.
The root cause is almost always the same: thresholds derived from one sensor, one season, or one biome are being applied to a landscape where the underlying conditions are fundamentally different. India's ecological diversity, from the Thar Desert to the Western Ghats, from the Indo-Gangetic Plain's double-cropped fields to the mangroves of the Sundarbans, means that a single set of NDVI thresholds for land cover classification will almost never travel cleanly across regions or even across seasons within the same region.
This article works through what NDVI values actually encode, why those values shift, and how to build a more defensible classification workflow for Indian landscapes.
What NDVI Is Actually Measuring (and What It Is Not)
NDVI, the Normalized Difference Vegetation Index, is a ratio of near-infrared (NIR) reflectance minus red reflectance, divided by their sum. It ranges theoretically from −1 to +1. Healthy, dense vegetation absorbs red light for photosynthesis and strongly reflects NIR, pushing values upward. Bare soil, water, and built-up surfaces occupy lower or negative ranges.
What NDVI does not do is measure vegetation type directly. It measures a spectral response that is influenced by:
- Chlorophyll content and canopy structure, the primary signal
- Soil background reflectance, especially important in sparse canopies where soil is visible between plants
- Atmospheric conditions, haze, aerosols, and water vapour all affect surface reflectance
- Sensor radiometric characteristics, band widths and calibration differ between Landsat, Sentinel-2, MODIS, and Resourcesat
- Phenological stage, the same crop field can produce NDVI values spanning 0.1 to 0.8 across a single growing season
Each of these factors can shift an NDVI value by 0.1 to 0.2 or more, which is the entire width of many classification thresholds. This is not a minor correction, it is the difference between getting the class right and getting it wrong.
How Indian Conditions Shift the Numbers
Soil Background Effects in Dryland Regions
In semi-arid and arid parts of India - Rajasthan, parts of Gujarat, the Deccan Plateau, vegetation cover is often sparse and patchy. When canopy cover is low, the sensor sees a mixture of plant and soil in the same pixel. Bright, sandy soils reflect strongly in both red and NIR, compressing the NDVI signal upward relative to what you would expect from the actual plant cover. Dark, ferruginous soils do the opposite. This means that a pixel of sparse scrub over bright sand may return a higher NDVI than a pixel of moderate grassland over dark basalt, even if the actual vegetation density is lower.
Indices like SAVI (Soil-Adjusted Vegetation Index) and MSAVI were designed specifically to reduce this soil background interference, and they are worth considering before you reach for a fixed NDVI threshold in these landscapes.
Monsoon Phenology and Temporal Variability
India's agricultural calendar is dominated by the Kharif and Rabi seasons, with a large share of cultivated land being rainfed. A paddy field in the Kharif season moves from near-bare-soil NDVI values at transplanting, through peak greenness at heading, to senescence at harvest, all within roughly four months. If your image is from August, that field looks like dense vegetation. If it is from November post-harvest, the same field looks like bare soil or fallow.
This is why single-date NDVI classification is almost always insufficient for agricultural mapping in India. A time-series approach, using multi-temporal composites or phenological metrics, is far more robust than applying a fixed threshold to a single scene.
Sensor Differences Matter More Than Practitioners Assume
Thresholds derived from Landsat 8 OLI data do not transfer directly to MODIS, and neither transfers cleanly to Sentinel-2 or Resourcesat-2 LISS-III. Band widths differ, and even small differences in the red and NIR band boundaries change the computed NDVI value for the same surface. Studies comparing sensors over the same area consistently find systematic offsets in NDVI, even after atmospheric correction. If you are working with Resourcesat data, which is the workhorse for many Indian government mapping programmes, thresholds from the international literature need to be treated as starting points, not final values.
A Worked Example: Building Region-Specific Thresholds
Suppose you are mapping land cover in a district in central India using Sentinel-2 imagery from October (post-Kharif harvest). Here is a practical workflow for deriving defensible thresholds rather than borrowing them from a paper:
-
Collect ground truth or high-confidence reference points for each class you care about, dense forest, degraded forest, agricultural land (harvested), agricultural land (standing crop), scrubland, built-up, and water. Even 30–50 well-distributed points per class is a reasonable start.
-
Extract NDVI values at each reference point from your specific image and sensor. Build a simple table or boxplot showing the NDVI distribution for each class.
-
Identify natural breaks or separation points between class distributions. If dense forest sits between 0.55 and 0.80 and scrubland sits between 0.20 and 0.45 in your data, those are your thresholds, not the ones from a global paper.
-
Validate with held-out reference points and compute a confusion matrix. Pay particular attention to confusion between spectrally similar classes (harvested cropland vs. scrubland is a classic problem in central India).
-
Document your thresholds and the conditions under which they were derived, sensor, date, atmospheric correction method, and study area. This is what makes your work reproducible and credible.
This process takes a few hours of careful work. It is not glamorous, but it is the difference between a classification that holds up to scrutiny and one that does not.
Practical Guidance for Indian Practitioners
- Never apply thresholds from a different sensor without checking for systematic offsets. Cross-sensor NDVI comparisons should be part of your preprocessing workflow.
- Use time-series composites for agricultural mapping. A single-date image will misclassify large areas depending on where the season is at capture time.
- In sparse-canopy regions, consider SAVI or EVI before defaulting to NDVI thresholds.
- State your thresholds explicitly in any report or publication, along with the image date, sensor, and study area. Readers cannot evaluate your classification without this information.
- When working with LISS-III or LISS-IV data, be especially careful about transferring thresholds from Landsat or Sentinel literature. The spectral response functions are different enough to matter.
The Bigger Picture
NDVI thresholds for land cover classification are not universal constants. They are contextual values that encode the interaction between vegetation, soil, atmosphere, and sensor on a specific date in a specific place. India's landscape diversity makes this especially important to internalise.
The most common mistake I see in student projects and even in some published work is treating a threshold found in a paper as authoritative without asking: was this derived under conditions similar to mine? Usually the answer is no, and the map suffers for it.
Deriving your own thresholds from reference data is not difficult. It is just more careful than copying a number from a table. Given that land cover maps feed into decisions about forest policy, agricultural insurance, and urban planning, the extra care is worth it.
Frequently asked questions
What NDVI value indicates dense vegetation in India?
There isn't one fixed value, thresholds vary by sensor, season, and region. In a worked example for a central Indian district, dense forest fell between NDVI 0.55 and 0.80, but such thresholds must be derived from local reference data, not borrowed from a paper.
Why does the same crop field show very different NDVI values across a season?
The same crop field can produce NDVI values spanning 0.1 to 0.8 across a single growing season, since phenology drives the signal, from near-bare soil at transplanting to peak greenness at heading to senescence at harvest.
Should I use SAVI instead of NDVI in sparse-vegetation areas like Rajasthan?
Yes, in sparse-canopy regions like Rajasthan, Gujarat, or the Deccan Plateau, soil-adjusted indices such as SAVI and MSAVI are worth considering before applying a fixed NDVI threshold, since they were designed specifically to reduce soil background interference in patchy vegetation.
Can I apply an NDVI threshold from a Landsat study to Sentinel-2 or Resourcesat imagery in India?
No. Thresholds derived from Landsat 8 OLI do not transfer directly to MODIS, Sentinel-2, or Resourcesat-2 LISS-III, since band-width differences cause systematic NDVI offsets even after atmospheric correction, treat published thresholds as starting points, not final values.
References
No specific external sources were cited in this article. The analysis and recommendations are based on general principles of remote sensing and the author's experience working with Indian satellite data.
Researched and drafted with AI assistance.
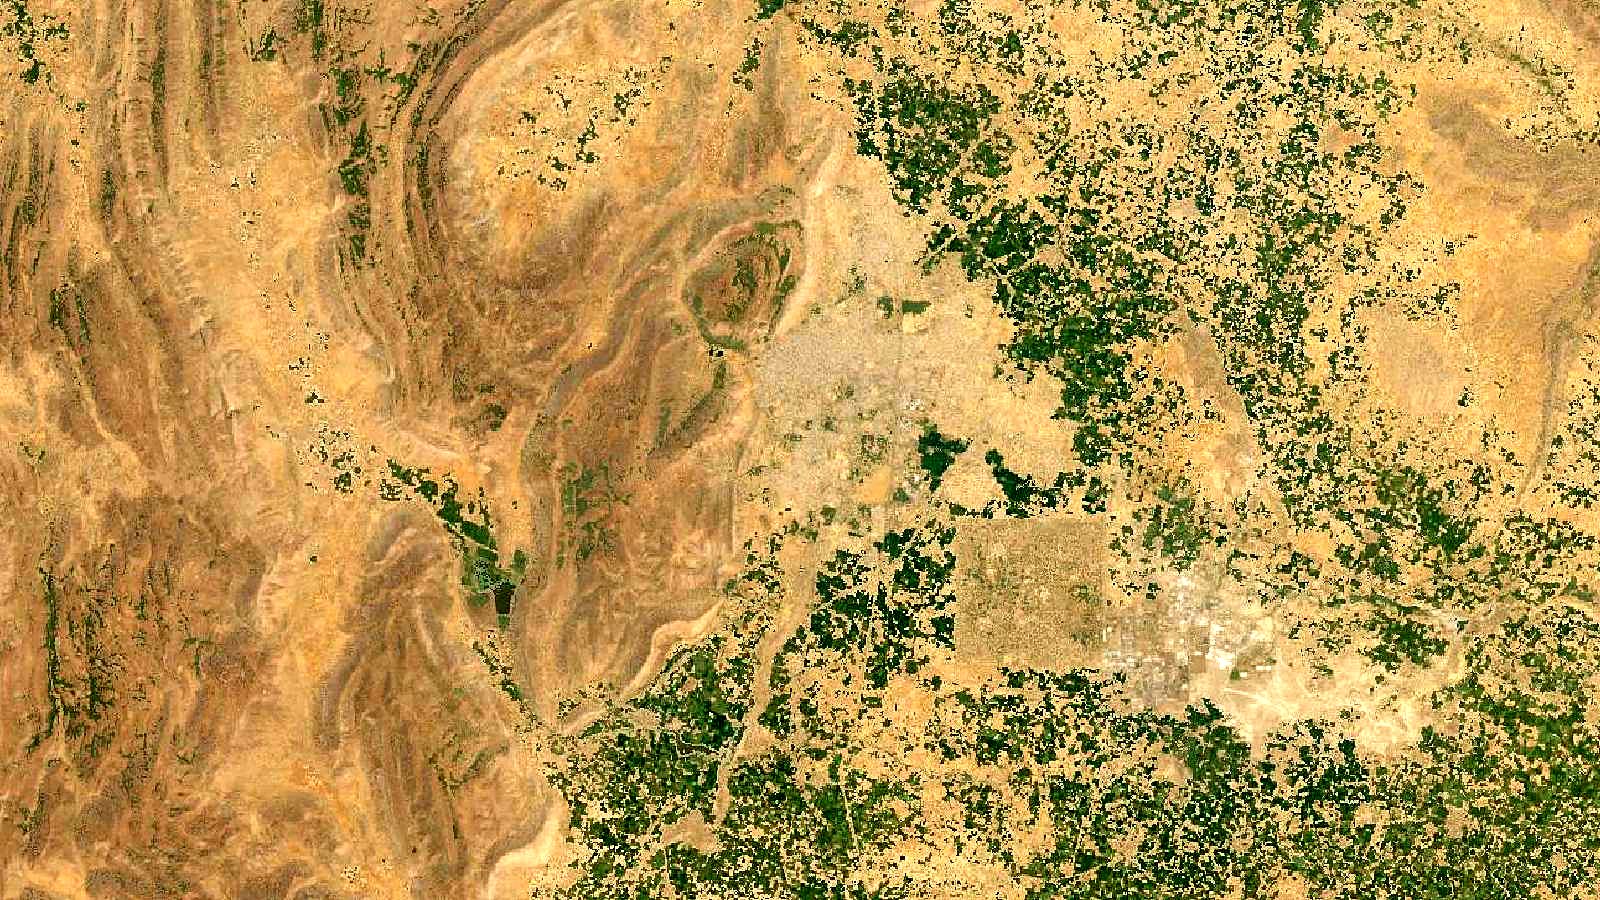
Cover image: Landsat true-colour composite of the Aravalli hills and farmland near Alwar, Rajasthan (2000), NASA/USGS Landsat WELD via NASA GIBS (public domain).