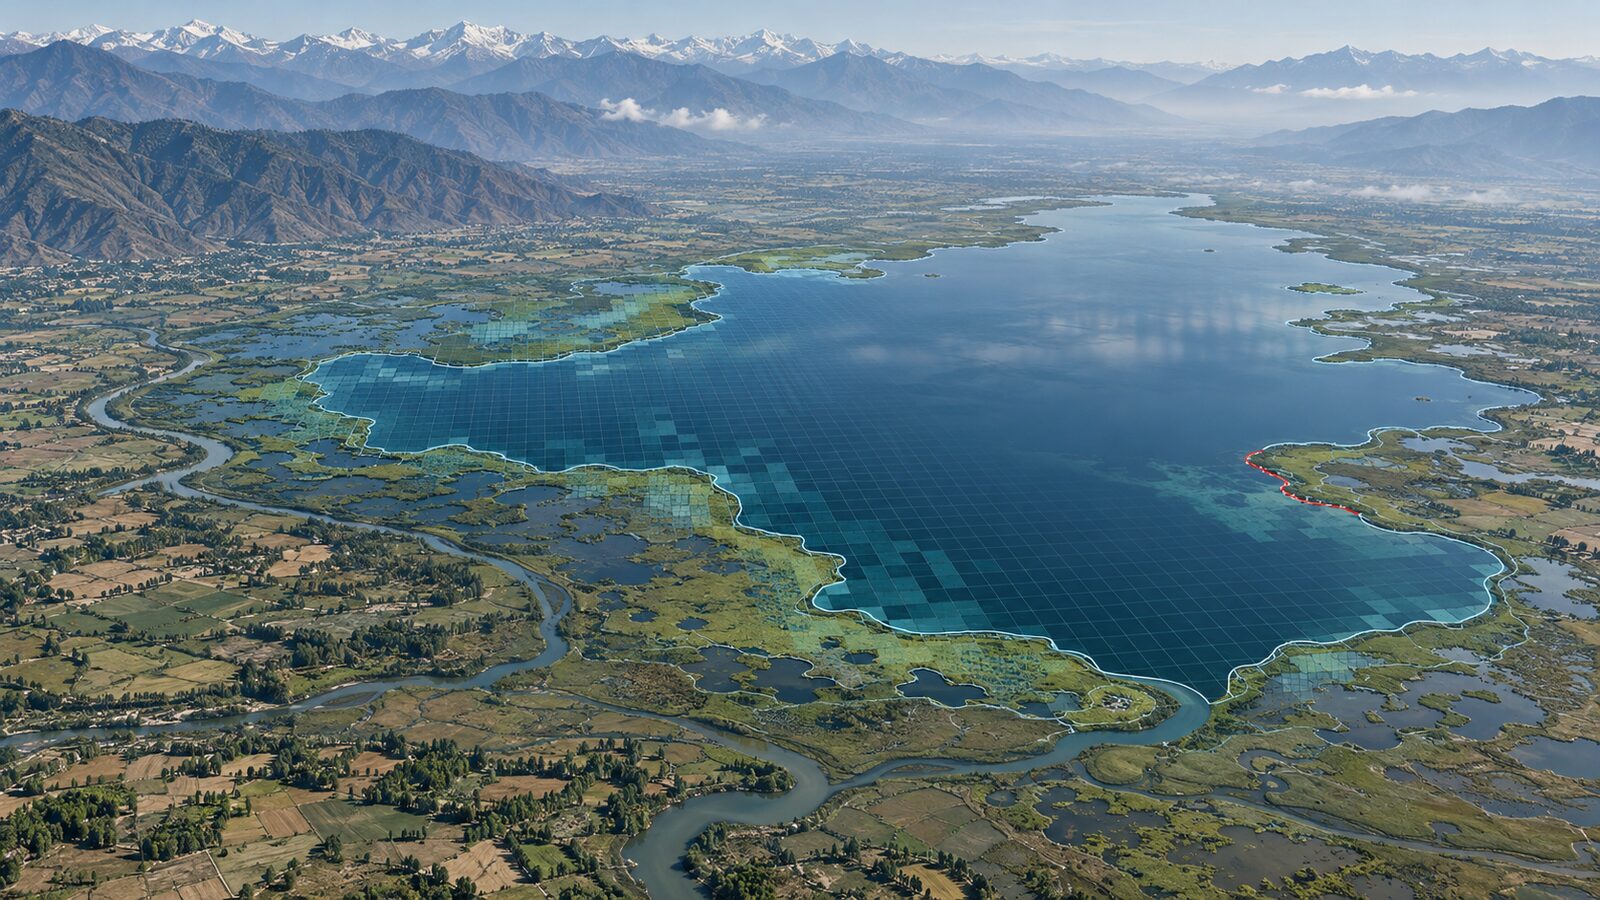
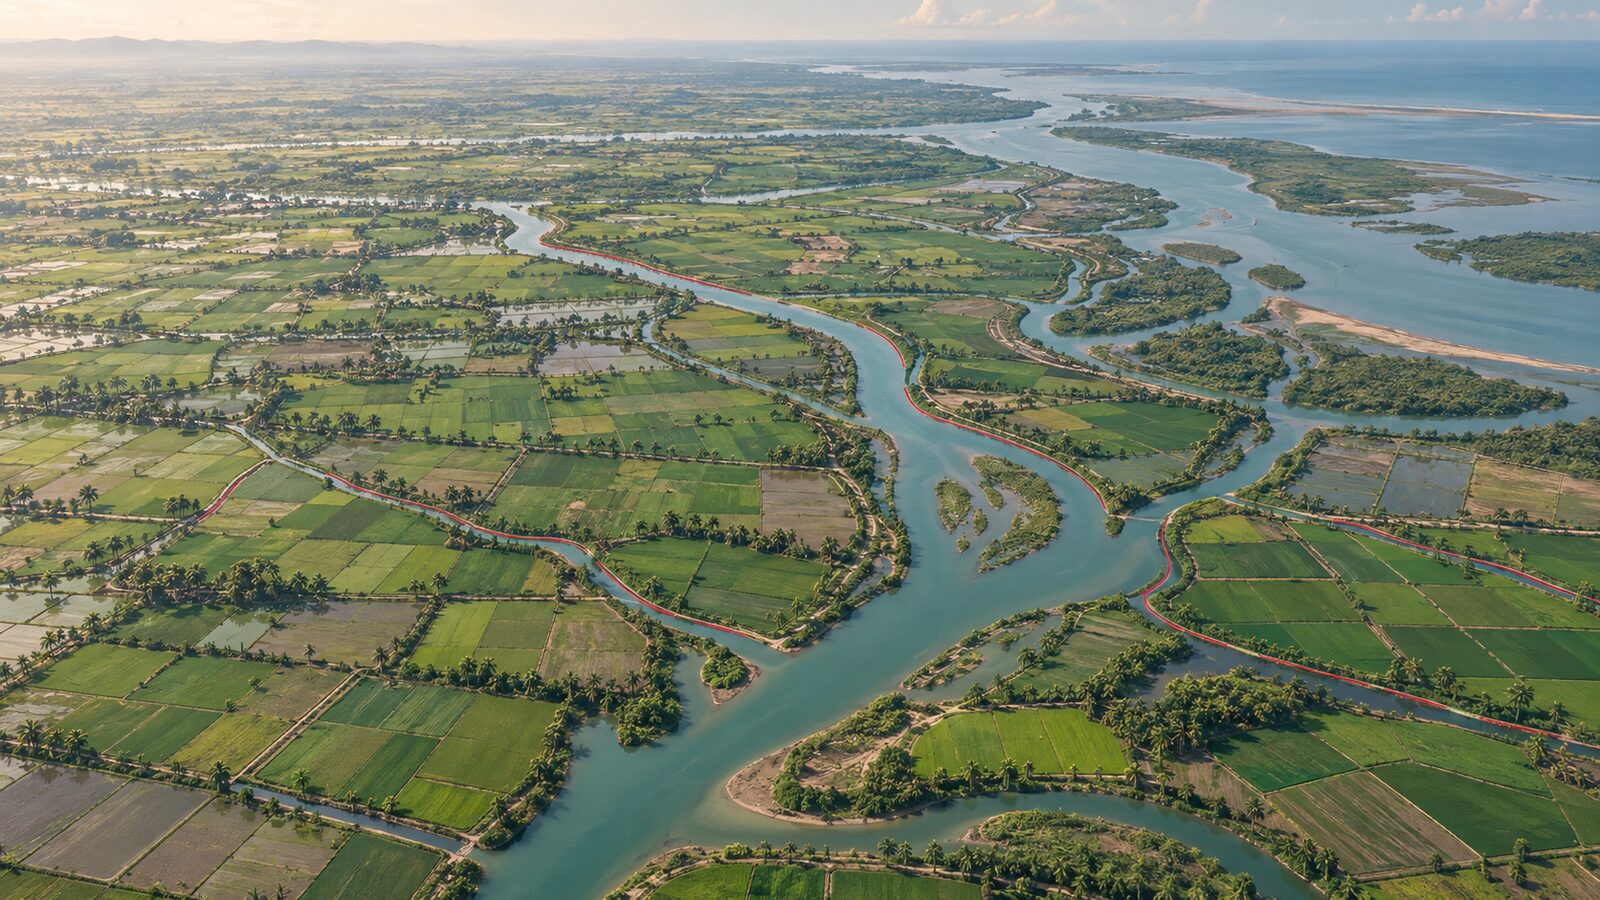
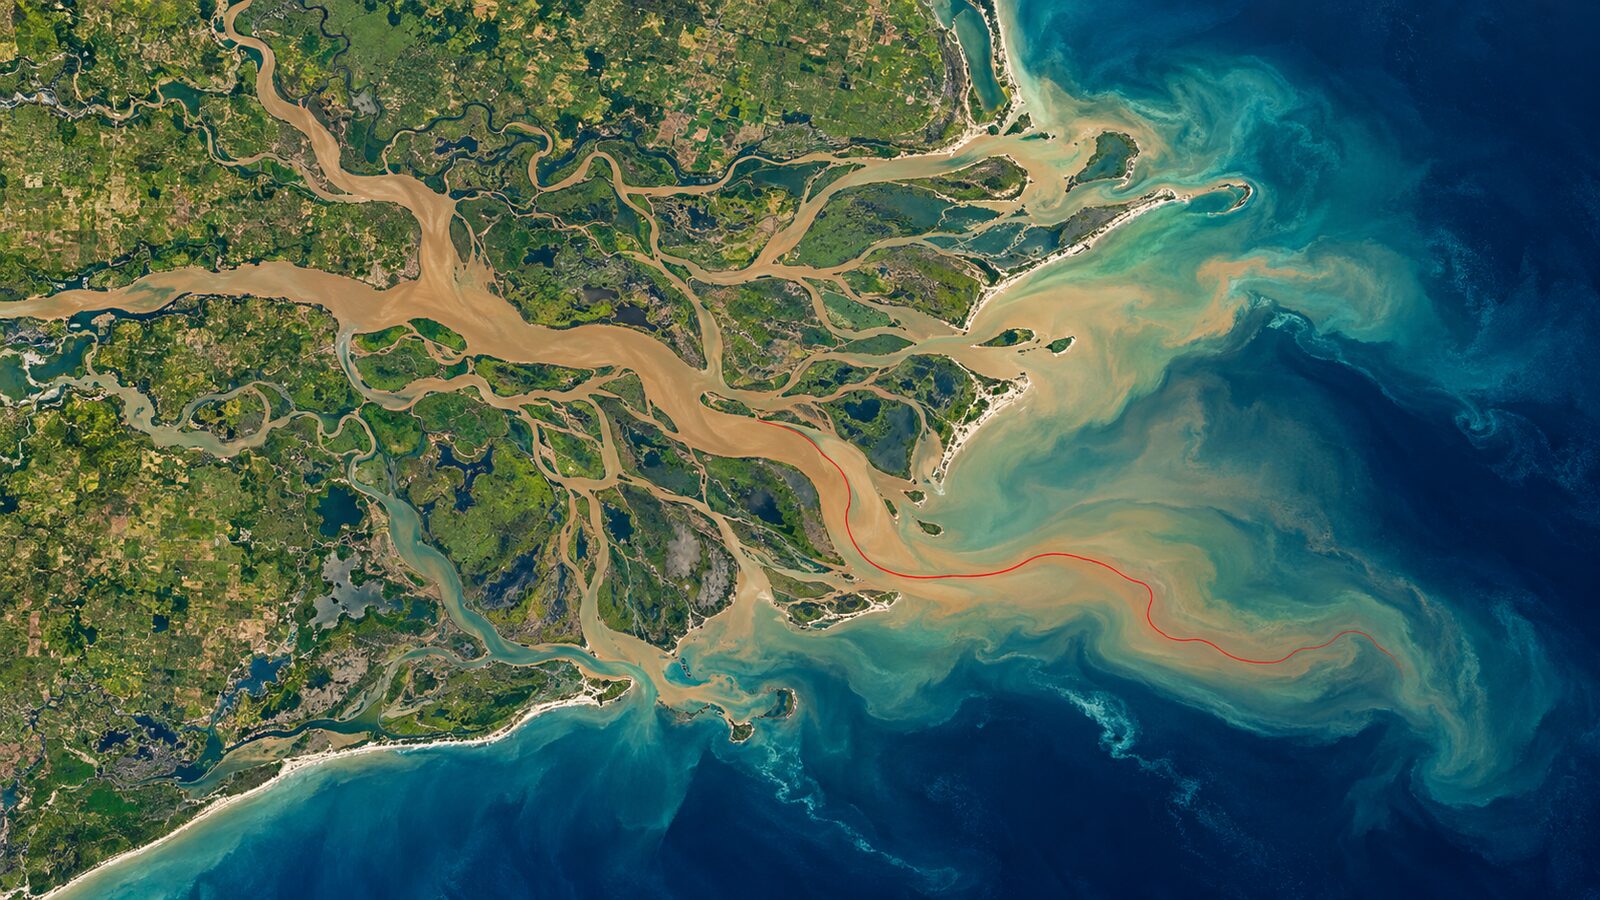
SAR Backscatter for Soil Moisture: Sentinel-1 Methods Explained
A technical walkthrough of how Sentinel-1 C-band SAR backscatter is used to estimate soil moisture across Indian agricultural land, covering the physics, key retrieval algorithms, and practical pitfalls.
Why Soil Moisture from Radar Matters Right Now
India's agricultural calendar runs on water, and increasingly, on the lack of it. From the rain-shadow districts of Marathwada to the semi-arid tracts of Rajasthan, knowing how much moisture is actually sitting in the top layer of soil can mean the difference between a timely irrigation decision and a crop failure. Ground sensors exist, but they are sparse, expensive to maintain, and impossible to scale across the 140 million-plus hectares of cultivated land in the country.
This is where SAR soil moisture estimation with Sentinel-1 enters the picture. Synthetic Aperture Radar sees through clouds, works day and night, and, critically, its backscatter signal is physically sensitive to the dielectric properties of soil, which change dramatically with water content. The European Space Agency's Sentinel-1 constellation has been providing free, consistent C-band (5.4 GHz) data since 2014, with a revisit of six days over most of India. The data are there. What practitioners often lack is a clear explanation of the physics, the retrieval chain, and the real-world pitfalls. This article tries to fill that gap.
How Radar Backscatter Encodes Soil Moisture
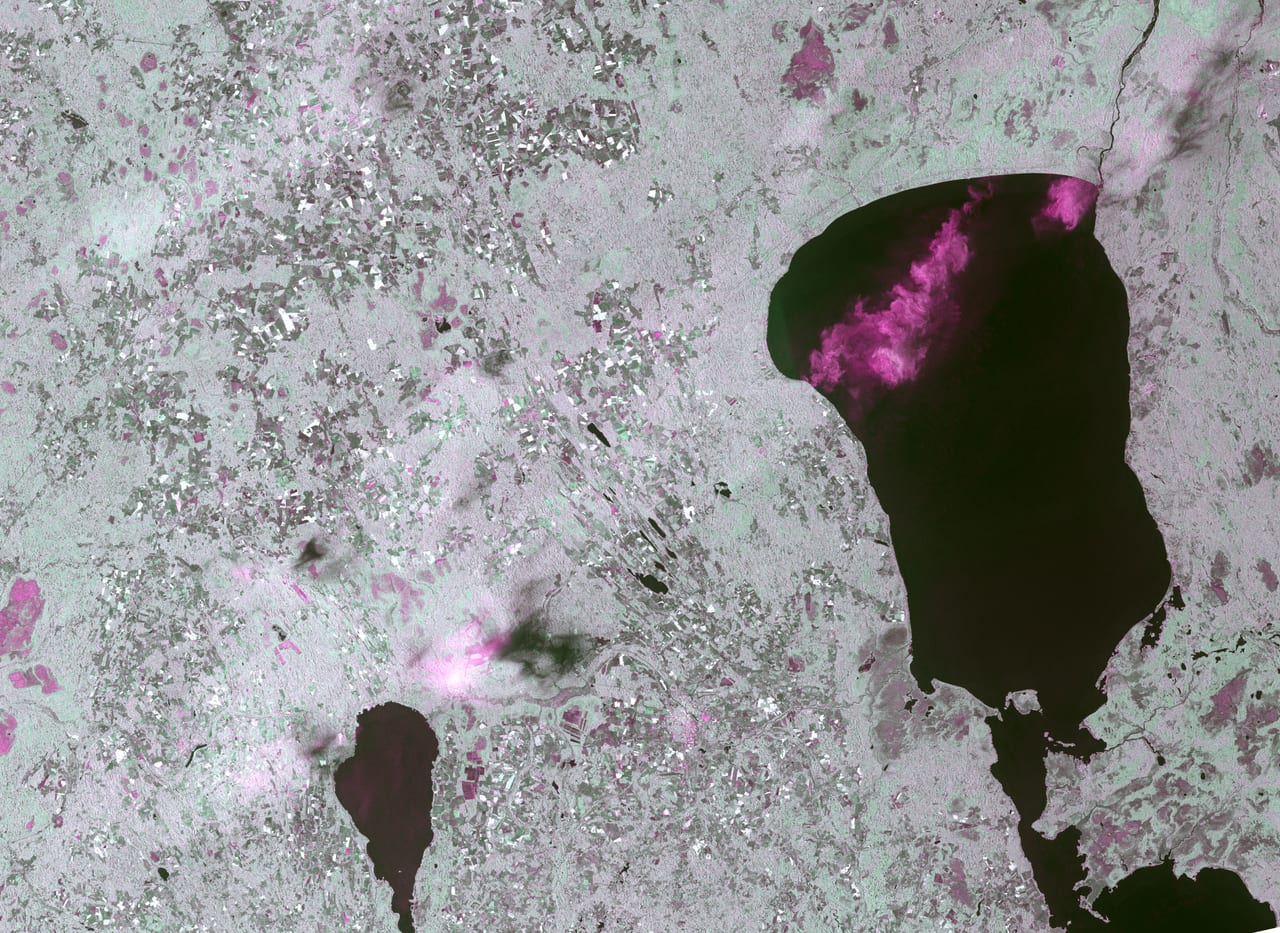
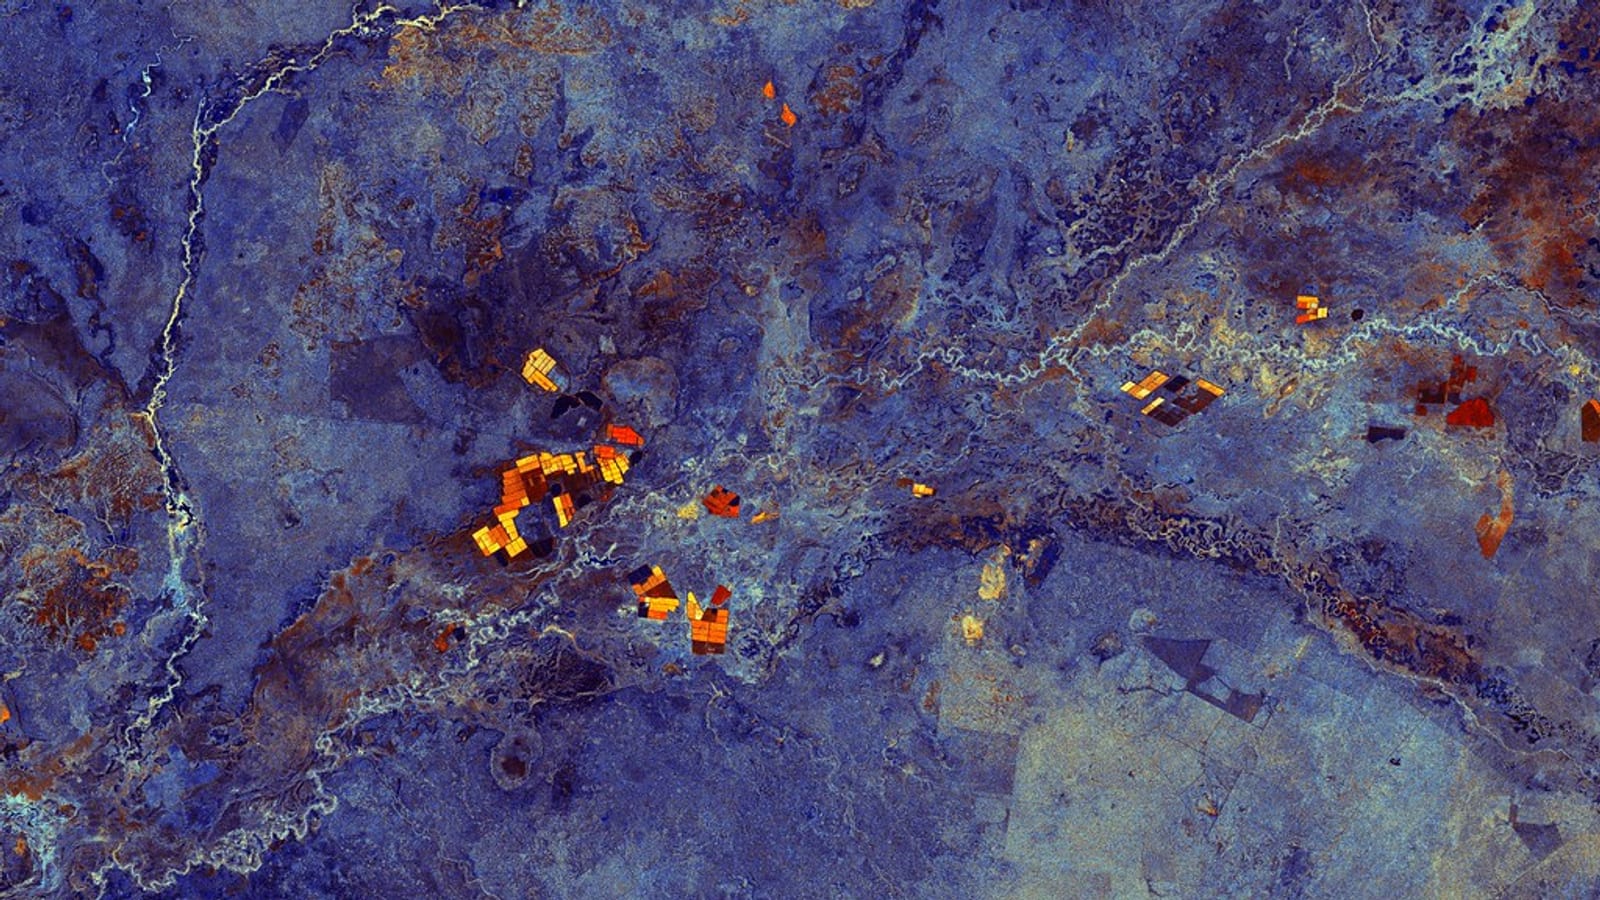
Illustrative: Sentinel-1 SAR backscatter farmland. "Thunderstorms over Estonia on a Copernicus Sentinel-1 synthetic aperture radar image" by * Satellite data: European Space Agency, 2015 Processing: Kaupo Voormansik, Tartu Observatory, 2015 is licensed under CC BY-SA 4.0. To view a copy of this license, visit https://creativecommons.org/licenses/by-
When a SAR pulse hits bare or sparsely vegetated soil, the fraction of energy scattered back to the sensor depends primarily on two things: surface roughness and the dielectric constant of the soil. The dielectric constant of dry soil is roughly 3–5, while that of liquid water is around 80. As soil moisture increases, the bulk dielectric constant of the soil-water mixture rises sharply, and more energy is reflected back, increasing the backscatter coefficient (σ°, expressed in dB).
This sensitivity is the physical foundation of every retrieval algorithm. The relationship is not linear in dB space, and it is not clean: roughness, vegetation cover, and soil texture all modulate the signal in ways that can swamp the moisture signature if you are not careful.
Sentinel-1 operates in two polarisations most useful for land applications: VV (vertical transmit, vertical receive) and VH (vertical transmit, horizontal receive). VV is more sensitive to soil dielectric properties and is the primary channel for bare-soil moisture retrieval. VH cross-polarisation is more sensitive to volume scattering from vegetation canopies, which is why it is often used to separate the vegetation contribution from the soil signal.
The Main Retrieval Approaches
There is no single "correct" algorithm. Practitioners typically choose based on data availability, computational resources, and how much ground truth they can access.
Change Detection (Relative Retrieval)
The simplest and most widely used approach in operational settings. Rather than estimating absolute volumetric moisture, you track how σ° changes over time relative to a dry reference and a wet reference image. The TU Wien method, developed for coarser sensors like ERS and ASCAT, has been adapted for Sentinel-1 and works on this principle.
Why it works in India: You can anchor your dry reference to post-monsoon or summer images and your wet reference to peak monsoon scenes. The method is relatively robust to calibration uncertainties and does not require soil texture maps.
Limitation: You get a relative wetness index (0–1), not volumetric water content in cm³/cm³. For irrigation scheduling, you often need the latter.
Physical Backscatter Models (IEM and Its Derivatives)
The Integral Equation Model (IEM) and its simplifications (AIEM, Oh model, Dubois model) describe σ° as a function of incidence angle, wavelength, dielectric constant, and surface roughness parameters (RMS height, correlation length). If you invert these models against observed σ°, you can retrieve the dielectric constant and then convert it to volumetric soil moisture using empirical mixing models (Dobson, Topp).
The roughness problem: This is the central practical challenge. Roughness parameters are spatially variable and change with tillage, rainfall, and crop cycles. If you fix roughness at a wrong value, your moisture estimate is biased. Some studies address this by using multi-angle or multi-temporal acquisitions to jointly retrieve roughness and moisture.
Machine Learning Approaches
Random forests, support vector regression, and increasingly neural networks are trained on paired (σ°, in-situ moisture) datasets. These bypass explicit physical modelling but require representative training data, which is scarce in India. Transfer learning from better-instrumented regions is an active research direction.
A Worked Example: Processing Sentinel-1 GRD Data for a Kharif Season
Here is a condensed workflow using freely available tools (ESA SNAP + Python):
- Download: Fetch Sentinel-1 IW GRD scenes (VV + VH) from the Copernicus Data Space for your area of interest, covering June–October for the kharif season.
- Preprocessing in SNAP:
- Apply orbit file
- Thermal noise removal
- Radiometric calibration → σ° (linear scale)
- Terrain correction using SRTM 1-arc-second DEM
- Convert to dB
- Masking: Use a crop mask (e.g., from ICAR-NAAS or Kharif season NDVI thresholding on Sentinel-2) to isolate agricultural pixels. Remove pixels with NDVI > 0.4 to reduce vegetation contamination on the SAR signal.
- Change detection: For each pixel, compute a scaled wetness index:
- ms = (σ° − σ°dry) / (σ°wet − σ°dry)
- where σ°dry and σ°wet are the 5th and 95th percentile σ° values across your time stack.
- Validation: Compare against ISRO's Bhuvan soil moisture portal or any available AWS (Automatic Weather Station) soil sensors from the IMD network.
This gives you a relative soil moisture map at 10 m resolution every six days, more than sufficient for district-level drought monitoring or irrigation advisory services.
Practical Pitfalls Specific to Indian Conditions
- Dense rice canopies: During peak kharif, rice paddies in Punjab, Haryana, and the Gangetic plain develop canopies that saturate the VV signal. The soil contribution becomes negligible. Use VH/VV ratio or switch to a vegetation-corrected water cloud model.
- Flooded fields vs. wet soil: Standing water in paddy fields produces specular reflection, very low backscatter, which looks like dry soil in naive retrieval. Always cross-check with optical or thermal data during transplanting season.
- Topographic effects: In the Western Ghats or Himalayan foothills, local incidence angle variation causes systematic σ° gradients unrelated to moisture. Terrain flattening in SNAP is essential, not optional.
- Wind-roughened surfaces: Post-monsoon winds can change surface roughness on bare fields overnight, shifting σ° by 1–2 dB, comparable to a significant moisture change.
- Orbit direction: Sentinel-1 acquires in both ascending and descending passes. Mixing them without accounting for the different local incidence angles will introduce artefacts.
Where This Is Heading
ISRO's RISAT-2B series and the upcoming NISAR mission (a joint NASA-ISRO L-band + S-band SAR) will add complementary wavelengths. L-band penetrates vegetation more deeply and is less sensitive to surface roughness, which addresses two of the biggest limitations of C-band Sentinel-1. When NISAR data become available, combining it with Sentinel-1 in a data fusion framework will likely become the standard approach for agricultural soil moisture monitoring in India.
For now, Sentinel-1 remains the workhorse. The data are free, the archive is deep, and the methods are mature enough for operational use, provided you understand what the backscatter signal is actually telling you, and what it is not.
Frequently asked questions
Which Sentinel-1 polarisation is best for bare-soil moisture retrieval?
VV polarisation is best for bare-soil moisture retrieval, since it is more sensitive to the soil's dielectric properties. VH cross-polarisation responds more to vegetation volume scattering and is typically used to separate out the vegetation contribution from the soil signal.
Why can flooded paddy fields look like dry soil in a SAR soil-moisture map?
Standing water in flooded paddy fields causes specular reflection, producing very low backscatter that can be mistaken for dry soil in naive retrieval. Always cross-check with optical or thermal imagery during the transplanting season to catch this.
What's the simplest way to estimate relative soil moisture from Sentinel-1 without soil texture data?
Change detection is the simplest and most widely used approach: it tracks how backscatter changes relative to a dry and a wet reference image, without needing soil texture maps. It yields a relative wetness index from 0 to 1, not absolute volumetric moisture.
How often does Sentinel-1 revisit the same area over India?
Sentinel-1 revisits most of India every six days, providing free, consistent C-band data since 2014. That frequency is enough to build a relative soil moisture map at 10 m resolution suitable for district-level drought monitoring or irrigation advisories.
References
- ESA Sentinel-1 Mission Overview: https://www.esa.int/Applications/Observing_the_Earth/Copernicus/Sentinel-1
- Copernicus Data Space Ecosystem (Sentinel-1 data access): https://dataspace.copernicus.eu/
- ESA SNAP Toolbox documentation: https://step.esa.int/main/toolboxes/snap/
- ISRO Bhuvan Geoportal (soil moisture and land data): https://bhuvan.nrsc.gov.in/
- NISAR Mission (NASA-ISRO): https://nisar.jpl.nasa.gov/
Researched and drafted with AI assistance.
Hero image: "Agricultural fields with SAR, Burke, Australia" by SentinelHub is licensed under CC BY 2.0. To view a copy of this license, visit https://creativecommons.org/licenses/by/2.0/.