Landsat Band Combinations: Which to Use and When
A practical reference guide to Landsat 8 and 9 band combinations — natural color, false color, agriculture, and more — with Indian landscape contexts including the IGP, Punjab croplands, and Deccan scrub.
Why Band Selection Still Matters in 2026
The June 2026 USGS Landsat newsletter landed in my inbox with the usual mix of operational updates and a teaser for Landsat 10's 2031 launch. Reading it reminded me of a recurring question I get from students and colleagues who are migrating from Sentinel-2 workflows to Landsat 8/9: which band combination should I actually load first?
Sentinel-2's 13 bands map onto familiar RGB slots with relatively little thought — most people default to B4/B3/B2 and move on. Landsat 8 and 9 have 11 bands with different wavelength positions and a different numbering convention, so the same muscle memory leads you astray. With Landsat 8 and 9 both fully operational and a decade of free archive behind them, getting band selection right is worth a proper reference. This article is that reference, built around Indian landscape contexts.
How Landsat 8 and 9 Bands Are Numbered
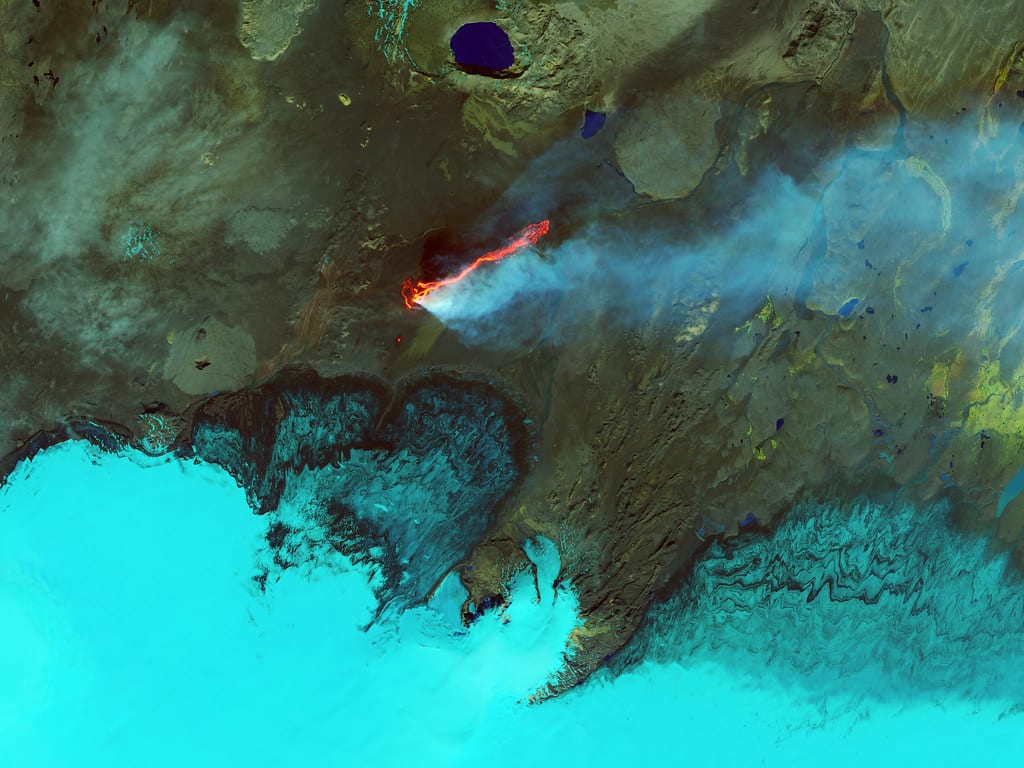
Illustrative: Landsat false color Punjab croplands. "Roiling Flows on Holuhraun Lava Field" by NASA Goddard Photo and Video is licensed under CC BY 2.0. To view a copy of this license, visit https://creativecommons.org/licenses/by/2.0/.
Before any combination makes sense, the band layout needs to be clear. Landsat 8 and 9 share an identical band structure across the Operational Land Imager (OLI) and Thermal Infrared Sensor (TIRS):
| Band | Name | Wavelength (µm) | Typical use |
|---|---|---|---|
| 1 | Coastal/Aerosol | 0.43–0.45 | Coastal water, aerosol studies |
| 2 | Blue | 0.45–0.51 | Water depth, urban |
| 3 | Green | 0.53–0.59 | Vegetation peak reflectance |
| 4 | Red | 0.64–0.67 | Chlorophyll absorption |
| 5 | NIR | 0.85–0.88 | Vegetation biomass |
| 6 | SWIR-1 | 1.57–1.65 | Soil moisture, geology |
| 7 | SWIR-2 | 2.11–2.29 | Geology, burned areas |
| 8 | Pan | 0.50–0.68 | 15 m panchromatic sharpening |
| 9 | Cirrus | 1.36–1.38 | Cloud detection |
| 10 | TIRS-1 | 10.6–11.19 | Land surface temperature |
| 11 | TIRS-2 | 11.5–12.51 | Land surface temperature |
The critical thing to internalise: Landsat's Band 4 is Red, not NIR. In Sentinel-2, Band 4 is Red too — but Sentinel-2's NIR is Band 8. When you build an NDVI in Landsat, you use (B5 − B4) / (B5 + B4). Mixing this up is the single most common error I see in student submissions.
The Core Combinations and When to Reach for Each
The combinations below are expressed as R / G / B channel assignments. Sources: Esri, Virginia Tech Pressbooks, Humboldt GSP, and NV5 Geospatial.
Natural Color — 4 / 3 / 2
This is the closest approximation to what the human eye would see from space. It is useful for general orientation, urban mapping, and communicating results to non-specialist audiences. In Indian contexts I use it for broad land-use classification drafts — it distinguishes built-up Bengaluru from the surrounding Deccan scrub reasonably well, and it renders the Indo-Gangetic Plain's agricultural patchwork in recognisable tones. Its weakness: healthy and stressed vegetation look similar, and haze over the IGP during winter can wash out contrast significantly.
Color Infrared (Vegetation) — 5 / 4 / 3
NIR in the Red channel makes healthy vegetation appear bright red. This is the workhorse combination for crop monitoring, forest health assessment, and any application where you need to separate vegetated from non-vegetated surfaces quickly. The IIETA study on Landsat 8–9 environmental monitoring highlights false-color composites — this combination in particular — as especially effective for identifying vegetation health and water bodies. In kharif season imagery over Punjab or Haryana, irrigated paddy fields glow a saturated red that makes mapping almost trivially easy.
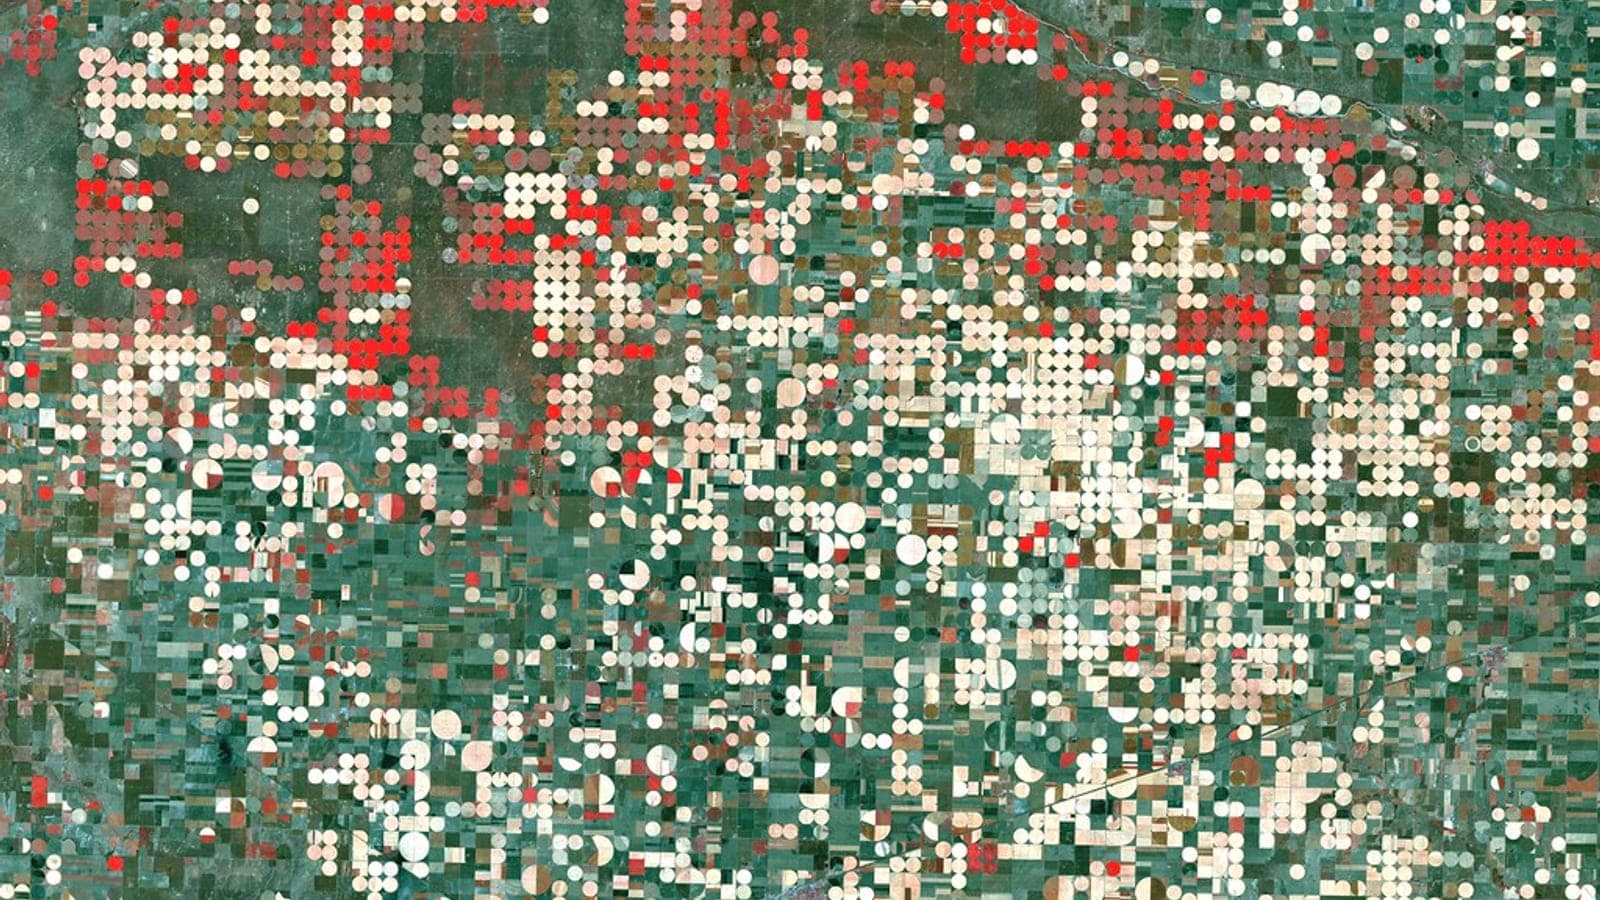
Agriculture — 6 / 5 / 2
SWIR-1, NIR, and Blue. Crops appear bright green, making this combination particularly legible for agricultural monitoring, as NV5 Geospatial notes. Bare earth reads as magenta. I find this combination useful during the rabi season when the 5/4/3 combination starts to confuse wheat with other green cover — the SWIR-1 channel adds enough moisture sensitivity to help separate crop types.
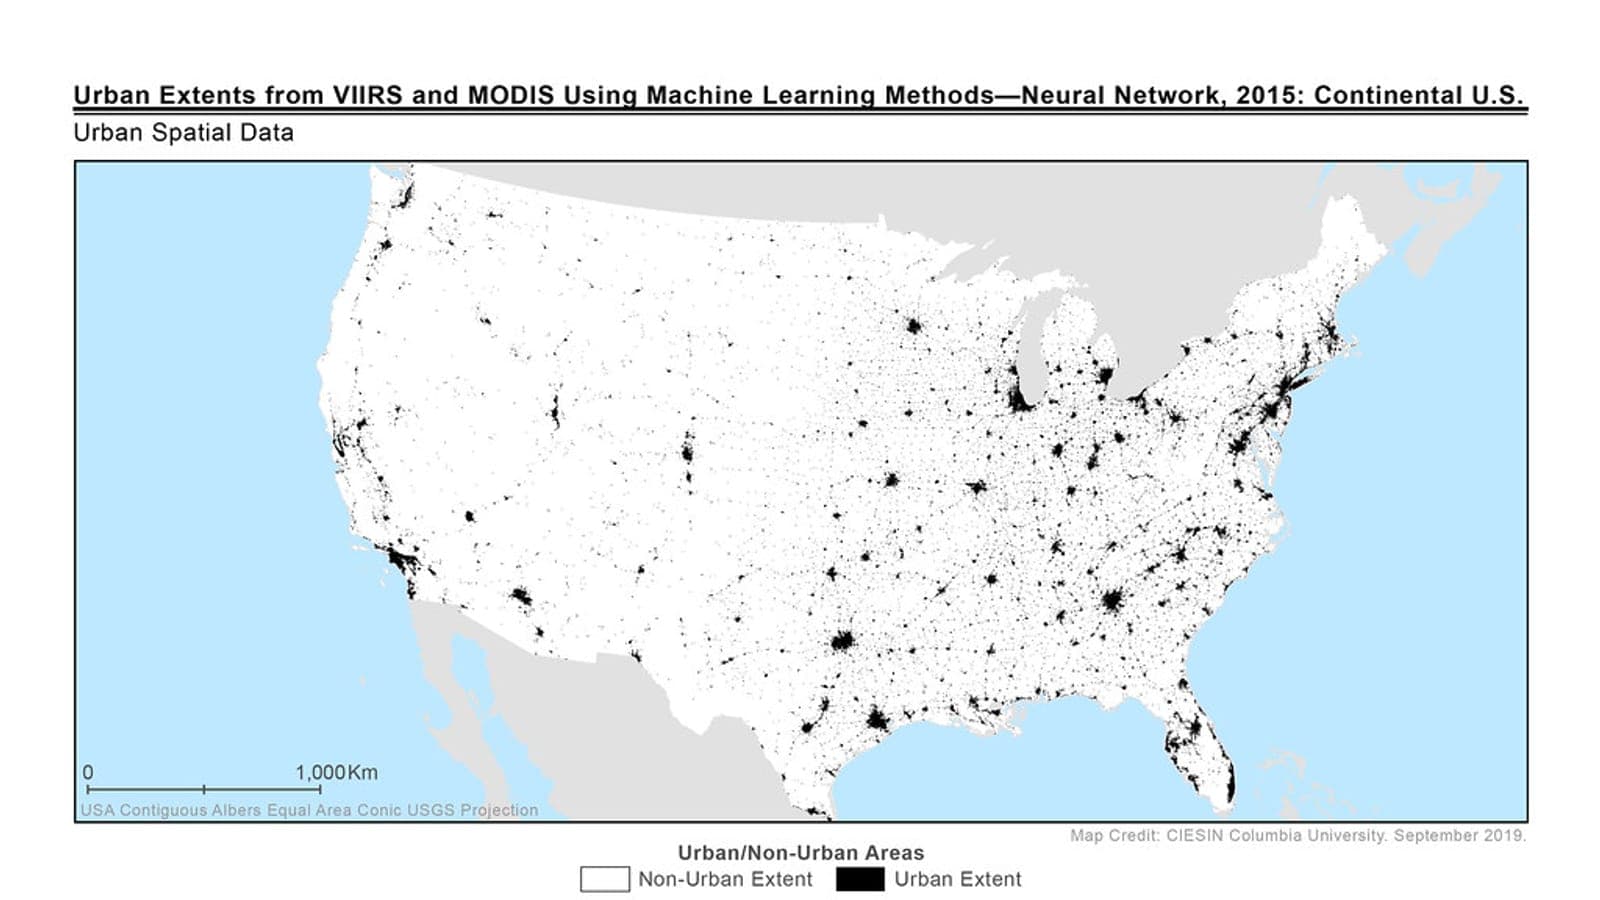
False Color Urban — 7 / 6 / 4
SWIR-2, SWIR-1, and Red. Built-up areas appear in white or cyan tones; vegetation is dark green; bare soil and rock are in brown-pink tones. This is my first choice for mapping urban expansion in Indian metros. The SatSummit analysis notes that false color images can clearly show the extent of a growing city — this combination is exactly what they mean. For tracking Hyderabad's or Pune's periurban sprawl into agricultural land, 7/6/4 gives you a clean separation that 4/3/2 simply cannot.
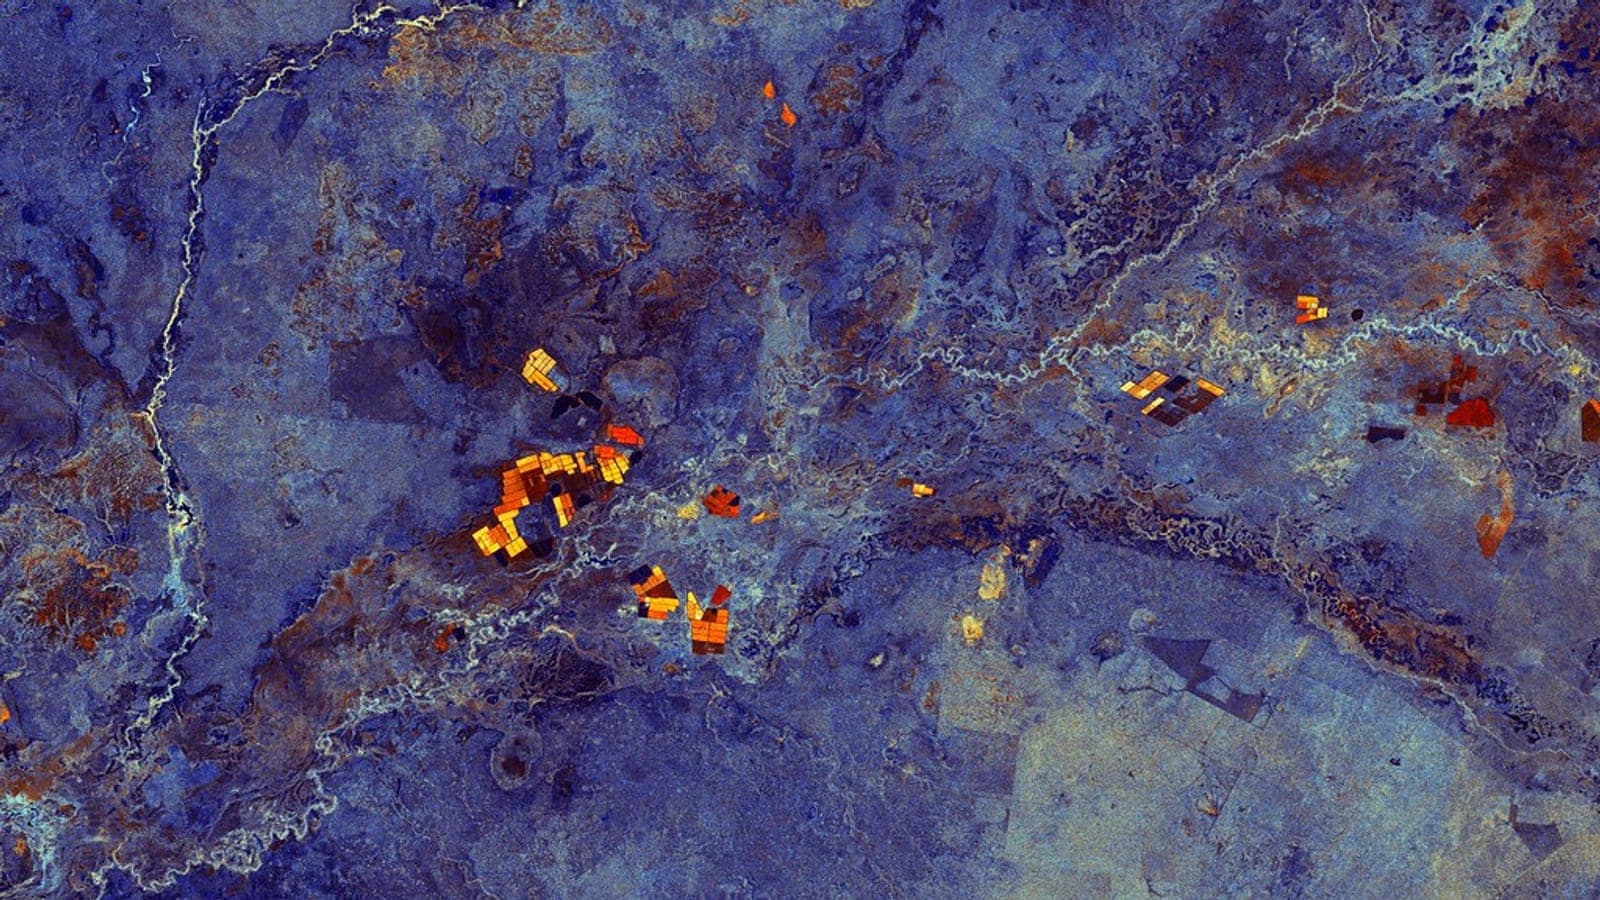
Shortwave Infrared — 7 / 5 / 4 (or 7 / 5 / 3)
Useful for geology and soil discrimination. SWIR-2 is sensitive to clay minerals and iron oxides, making it valuable for lithological mapping in the Deccan Trap basalts, the Aravallis, or the Vindhyan sedimentaries. Burned area scars also appear dark against surrounding vegetation in this combination.
A Quick Summary List
- 4/3/2 — General purpose, presentations, urban mapping drafts
- 5/4/3 — Vegetation health, crop monitoring, forest cover
- 6/5/2 — Agriculture, crop-type separation, irrigated vs. rainfed
- 7/6/4 — Urban expansion, impervious surface mapping
- 7/5/4 — Geology, burned areas, soil mineralogy
- 5/6/4 — Healthy vegetation emphasis with moisture context
A Worked Example: Mapping Paddy Extent in the Krishna Delta
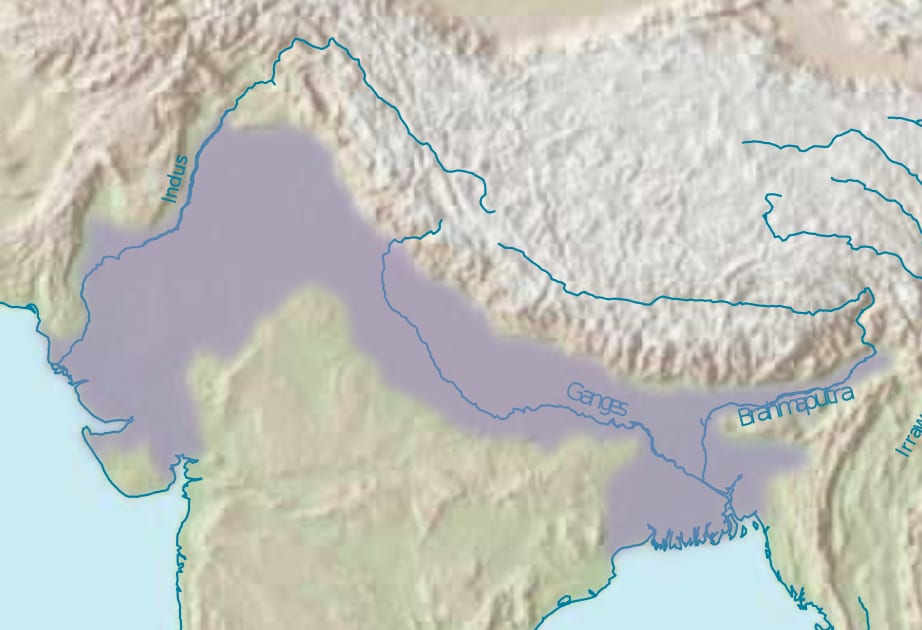
Illustrative: Indo-Gangetic Plain satellite imagery. "Indo-Gangetic Plain" by Jeroen is licensed under CC BY-SA 2.5. To view a copy of this license, visit https://creativecommons.org/licenses/by-sa/2.5/.
Here is how I would approach a practical task — estimating kharif paddy extent in the Krishna–Godavari delta region of Andhra Pradesh using a single Landsat 9 scene.
Step 1 — Load 5/4/3 (Color Infrared). Active paddy fields during peak vegetative growth (roughly August–September) will appear as bright, saturated red patches. This gives you a quick visual inventory of irrigated area extent.
Step 2 — Switch to 6/5/2 (Agriculture). Now the paddy fields shift to bright green. The SWIR-1 band (6) is sensitive to canopy water content, so flooded or heavily irrigated paddy separates more cleanly from dryland crops like groundnut or cotton, which appear in duller greens or yellows.
Step 3 — Check 7/6/4 (False Color Urban) to confirm that bright patches in the 5/4/3 image are not built-up areas on the delta's urban fringe (Vijayawada, Eluru) masquerading as vegetation.
Step 4 — Compute NDVI = (B5 − B4) / (B5 + B4). Threshold at approximately 0.4–0.5 for the peak season to isolate dense canopy. Cross-validate against the visual interpretation from Step 1.
This four-step visual triage takes under ten minutes and dramatically reduces misclassification before you commit to any supervised classification.
Looking Ahead: Landsat 10 and What Changes
The June 2026 newsletter previews Landsat 10, targeted for a 2031 launch. The newsletter teases the imagery it will capture but does not yet publish a final band specification. The implication for analysts: the band numbering conventions you build fluency with now on Landsat 8/9 will likely carry forward in spirit, but it is worth watching the USGS Landsat programme page as instrument details are confirmed. The archive continuity that makes Landsat so valuable for long-term change detection — think decadal urban growth or monsoon-driven vegetation dynamics — depends on spectral consistency across missions.
For now, Landsat 8 and 9 are the operational pair. Master their band combinations, and you will be well positioned when Landsat 10 data starts flowing.
References
- USGS. Latest in Landsat — June 2026, Vol. 5 Issue 6. https://www.usgs.gov/latest-landsat-newsletter/latest-landsat-june-2026
- Esri. Band Combinations for Landsat 8. https://www.esri.com/arcgis-blog/products/product/imagery/band-combinations-for-landsat-8
- Virginia Tech Pressbooks. Chapter 16: Band Combinations for Landsat 9 Imagery. https://pressbooks.lib.vt.edu/remotesensing/chapter/chapter-16-band-combinations-for-landsat-9-imagery/
- SatSummit Landscape. Analysis — Band Combinations. https://landscape.satsummit.io/analysis/band-combinations.html
- NV5 Geospatial. The Many Band Combinations of Landsat 8. https://www.nv5geospatialsoftware.com/Learn/Blogs/Blog-Details/the-many-band-combinations-of-landsat-8
- IIETA / Traitement du Signal. Enhancing Environmental Monitoring with Landsat 8–9. https://www.iieta.org/journals/ts/paper/10.18280/ts.420601
- Humboldt State University GSP. Natural and False Color Composites. https://gsp.humboldt.edu/olm/Courses/GSP_216/lessons/composites.html
Researched with AI assistance and reviewed by Jannat Khosla.
Hero image: "Garden City, Kansas" by NASA Goddard Photo and Video is licensed under CC BY 2.0. To view a copy of this license, visit https://creativecommons.org/licenses/by/2.0/.