Mapping Rice Transplanting with Sentinel-1 VH in GEE
A practical Sentinel-1 Google Earth Engine workflow for spotting rice transplanting signals in monsoon and samba paddy landscapes, with notes on VH backscatter, filtering, validation and beginner mistakes.
Why rice transplanting shows up in Sentinel-1
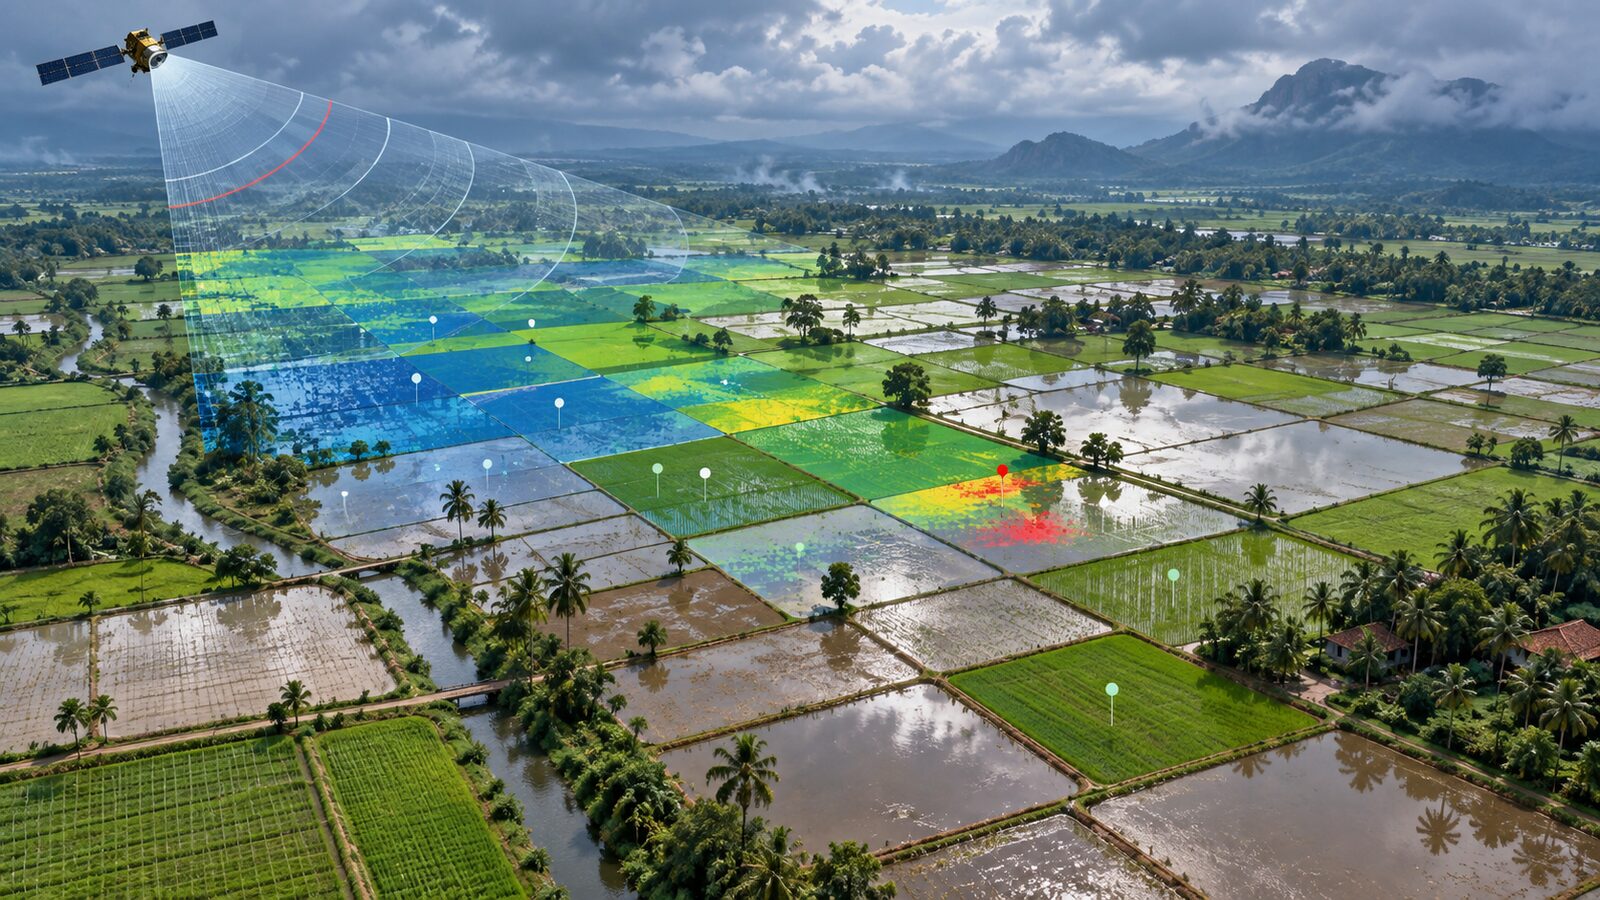
Rice is one of the best crops for learning SAR time-series analysis because its field condition changes sharply during the season. A transplanted paddy field is often flooded at the beginning, then develops a denser canopy during vegetative growth, and finally loses structure after harvest. Optical sensors can capture this too, but monsoon cloud cover makes regular observation difficult in many Indian rice belts.
Sentinel-1 helps because it is a C-band Synthetic Aperture Radar mission from ESA and Copernicus. In Google Earth Engine, the COPERNICUS/S1_GRD collection provides Ground Range Detected scenes from a 5.405 GHz SAR instrument, already processed into calibrated, ortho-corrected backscatter in decibels. The collection includes common polarisation combinations such as VV, VH and VV+VH, plus an angle band. Earth Engine documentation also stresses an important practical point: Sentinel-1 data are heterogeneous, so you should filter by polarisation, instrument mode, orbit pass and resolution before analysis.
For paddy rice, the most useful signal is often VH backscatter. A Scientific Data study covering Bangladesh and Northeast India used Sentinel-1 time series in Google Earth Engine and reported that VH was more sensitive to rice growth stages than VV. The reason is physical: flooded fields tend to return low backscatter, while standing rice plants create more volume scattering as the canopy develops.
A recent study from the Cauvery Delta Zone of Tamil Nadu gives useful Indian numbers for interpretation. It found minimum VH backscatter around the start of season, from -22.03 to -17.69 dB, and maximum values from -16.10 to -14.20 dB near heading, with a mean increase of 5.07 dB during crop growth. Do not treat these as universal thresholds. Treat them as a pattern to test against local crop calendars and field points.
A practical workflow for the Cauvery Delta
Let us build a compact Earth Engine recipe for samba rice near Thanjavur and Thiruvarur. The aim is not to produce an official crop map. It is to detect likely transplanting windows by finding where VH is low early in the season and then rises as the crop grows.
The Cauvery Delta is a good teaching region because paddy is extensive, fields are relatively visible in satellite time series, and the Tamil Nadu study reports start-of-season mapping for samba rice from 2017-18 to 2022-23. The same paper defines the Cauvery Delta Zone as covering Cuddalore, Nagapattinam, Thanjavur, Thiruvarur and Tiruchirappalli districts, with longitudes from 78 degrees 15 minutes E to 79 degrees 45 minutes E and latitudes from 10 degrees N to 11 degrees 30 minutes N.
Step 1: Choose the season and area
In GEE, start with a polygon over your study area. For a student exercise, keep the polygon small: a few blocks around Thanjavur or Thiruvarur are enough. Then choose the season. The Tamil Nadu study used samba season imagery from August to January, and found major planting periods generally from late September to November, depending on year.
var aoi = ee.Geometry.Rectangle([79.0, 10.65, 79.45, 11.05]);
Map.centerObject(aoi, 10);

var start = '2021-08-01';
var end = '2022-01-31';
Step 2: Filter Sentinel-1 correctly
Earth Engine’s Sentinel-1 guide recommends filtering the collection into a homogeneous subset. For rice in much of India, begin with IW mode, 10 metre resolution, and images containing both VV and VH. You can then test ascending and descending separately.
var s1 = ee.ImageCollection('COPERNICUS/S1_GRD')
  .filterBounds(aoi)
  .filterDate(start, end)
  .filter(ee.Filter.eq('instrumentMode', 'IW'))
  .filter(ee.Filter.eq('resolution_meters', 10))
  .filter(ee.Filter.listContains('transmitterReceiverPolarisation', 'VV'))
  .filter(ee.Filter.listContains('transmitterReceiverPolarisation', 'VH'))
  .filter(ee.Filter.eq('orbitProperties_pass', 'DESCENDING'))
  .select(['VV', 'VH', 'angle']);

print('Sentinel-1 images', s1.size());
Why keep one orbit pass? SAR backscatter depends on viewing geometry. If you merge ascending and descending observations too early, you may confuse orbit-related differences with crop change. Once you understand the local signal, you can compare both passes or build separate models.
Step 3: Make monthly VH composites
A simple first product is monthly median VH. It reduces speckle and helps you see whether fields move from dark flooded conditions towards brighter crop structure.
function monthlyMedian(month) {
  month = ee.Number(month);
  var startMonth = ee.Date('2021-08-01').advance(month, 'month');
  var endMonth = startMonth.advance(1, 'month');
  return s1.filterDate(startMonth, endMonth)
    .select('VH')
    .median()
    .set('system:time_start', startMonth.millis())
    .set('label', startMonth.format('YYYY-MM'));
}

var months = ee.List.sequence(0, 5);
var vhMonthly = ee.ImageCollection(months.map(monthlyMedian));

var vhVis = {min: -25, max: -10, palette: ['0b1d3a', '2b8cbe', 'a6bddb', 'ffffbf']};
Map.addLayer(vhMonthly.first().clip(aoi), vhVis, 'VH first month');
The visual interpretation is straightforward. Flooded or very smooth surfaces are darker. As rice grows, the VH response should increase. The Scientific Data paper describes low backscatter during flooding or transplanting, a significant increase during vegetative growth, and a decrease after harvest.
Step 4: Convert the idea into a rule
For a beginner-friendly rule, calculate the minimum VH value during the early season and the maximum VH value during the growth period. The Tamil Nadu study used parameters from VH temporal signatures and reported that rice showed a clear increase from start of season to flowering. We can express that logic in GEE.
var early = s1.filterDate('2021-09-01', '2021-11-15').select('VH');
var growth = s1.filterDate('2021-11-16', '2022-01-15').select('VH');

var vhMin = early.min();
var vhMax = growth.max();
var vhRise = vhMax.subtract(vhMin).rename('VH_rise');

var likelyRice = vhMin.lt(-17.5).and(vhRise.gt(4.0)).rename('likely_rice');

Map.addLayer(vhRise.clip(aoi), {min: 0, max: 8, palette: ['white', 'yellow', 'green']}, 'VH rise');
Map.addLayer(likelyRice.selfMask().clip(aoi), {palette: ['00ff55']}, 'Likely transplanted rice');
This is deliberately conservative and educational. The -17.5 dB and 4.0 dB values are not official cut-offs. They are starting values inspired by the Cauvery Delta ranges reported in the 2025 study, where start-of-season minima were from -22.03 to -17.69 dB and mean growth-stage increase was 5.07 dB. For a real project, tune these values with field samples, crop calendars and district-wise agronomic knowledge.
Step 5: Add validation points
A map is not a result until it has been checked. Collect points for rice and non-rice locations from field visits, high-resolution imagery, or reliable local knowledge. Split them into training and validation only if you are building a classifier. For this rule-based example, use the points to inspect whether the VH curves make sense.
var chart = ui.Chart.image.series({
  imageCollection: s1.select('VH'),
  region: aoi,
  reducer: ee.Reducer.mean(),
  scale: 10
}).setOptions({
  title: 'Mean Sentinel-1 VH backscatter over AOI',
  vAxis: {title: 'VH dB'},
  hAxis: {title: 'Date'}
});
print(chart);
If your rice points do not show a low-to-high VH pattern, investigate before changing the threshold. The field may be direct seeded rather than transplanted, the season window may be wrong, the crop may already be harvested, or the AOI may include mixed pixels from roads, ponds, trees and settlements.
Common beginner mistake: mixing everything together
The most common mistake is loading Sentinel-1, taking a mean image, and classifying it without filtering the metadata. This is risky because the collection contains different modes, polarisations, resolutions and orbit directions. Earth Engine’s own Sentinel-1 guide says filtering to a homogeneous subset is usually necessary.
Another common mistake is assuming one dB threshold works everywhere in India. It does not. Rice management in the Cauvery Delta, Assam floodplains, coastal Andhra Pradesh and Punjab differs by water source, transplanting date, field size and crop calendar. Use published thresholds only as a first hypothesis, then check local time-series curves.
A third mistake is forgetting that SAR is sensitive to geometry. Buildings, bunds, trees and rough soil can all produce bright returns. A high VH value is not automatically rice. The rice signature is temporal: low during flooding or transplanting, rising as plants grow, then often reducing after harvest.
How recruiters should read this skill
For a portfolio, this workflow demonstrates more than button-clicking in GEE. It shows sensor knowledge, metadata filtering, time-series reasoning, agronomic interpretation and validation awareness. A junior analyst who can explain why VH is used, why orbit pass matters, and why thresholds must be localised is already thinking beyond decorative maps.
For students, the best next step is to repeat the same workflow in another rice belt. Keep the code structure identical, but change the AOI, crop calendar and validation points. If the VH curve changes, do not panic. That difference is the remote-sensing lesson.
Frequently asked questions
Can Sentinel-1 map rice during cloudy monsoon months?
Yes, Sentinel-1 is useful during cloudy monsoon months because SAR can acquire observations in day or night and in cloudy conditions. The workflow still needs careful filtering, seasonal timing and validation, because cloud independence does not remove confusion from settlements, water bodies or mixed fields.
Should I use VH or VV for paddy rice?
Use VH as the first band to test for paddy rice, because published rice studies have found it sensitive to growth-stage changes. VV is still useful as supporting information, especially in classifiers, but VH time-series curves are often easier for beginners to interpret.
Are the dB thresholds in this post valid across India?
No, the dB thresholds are only starting values for experimentation. They are based on reported Cauvery Delta VH ranges and should be adjusted for each region, season, orbit pass and field condition using ground points or trusted local crop information.
Why filter by orbit pass in Earth Engine?
Filter by orbit pass because SAR backscatter changes with viewing geometry. Keeping ascending and descending scenes separate makes the time series cleaner and reduces the chance that geometry differences are mistaken for crop growth or transplanting signals.
References
- Google Earth Engine Data Catalog: Sentinel-1 SAR GRD
- Google Earth Engine guide: Sentinel-1 Algorithms
- ESA: Sentinel-1 Data products
- Scientific Data: High resolution paddy rice maps in cloud-prone Bangladesh and Northeast India using Sentinel-1 data
- Scientific Reports: Time series analysis of Sentinel 1A SAR data to retrieve annual rice area maps and long-term dynamics of start of season
Cover image: AI-generated illustration (ChatGPT image generation), not satellite data.
Researched and drafted with AI assistance; sources are linked for verification.