NISAR GUNW in QGIS for Mining Subsidence Mapping
A practical guide to using NISAR geocoded unwrapped interferograms in QGIS, with a Jharia Coalfield workflow for line-of-sight displacement, coherence masking and beginner quality checks.
Why NISAR changes the deformation workflow
For Indian geospatial students, NISAR is not just another radar satellite. It is a NASA-ISRO Synthetic Aperture Radar mission built around two microwave bands: NASA's 24 cm L-band radar and ISRO's 9.4 cm S-band radar. The observatory was launched from Satish Dhawan Space Centre on 30 July 2025, flies in a 747 km sun-synchronous orbit with 98.4 degree inclination, and has a 12-day exact repeat cycle. NASA lists the nominal SAR resolution as 3 to 10 metres, depending on acquisition mode, with free and open data access.
The practical change is that NISAR distributes analysis-ready products that reduce the amount of specialist SAR processing a beginner has to do before making a GIS layer. Instead of starting from raw complex radar scenes, a student can begin with a Level 2 Geocoded Unwrapped Interferogram, usually called GUNW, and inspect displacement-related phase, coherence and masks directly in QGIS.
That matters for places such as the Jharia Coalfield in Jharkhand. Jharia is one of India's most important and long-studied mining landscapes, and recent peer-reviewed work has used Sentinel-1 SAR time-series processing to analyse subsidence in eastern Jharia between January 2018 and January 2021. NISAR does not replace field checks, levelling or GNSS, but its regular radar acquisition is useful for building a repeatable screening workflow over mining, groundwater, landslide and infrastructure corridors.
What a GUNW product contains
The ASF NISAR Data User Guide describes GUNW as a Level 2 product derived from wrapped and unwrapped interferogram products. It is geocoded, which means it can be overlaid on a map in GIS, unlike Level 1 radar-coordinate products. For GUNW, the unwrapped interferometric phase is posted at 80 m, and the product also includes coherence, connected components, ionospheric phase screen layers and related uncertainty layers. ASF notes that only co-polarised HH or VV nearest-neighbour 12-day GUNW products are generated as part of the mission.
This is a different product from GCOV or GSLC. GCOV is the more straightforward product when your task is radiometrically terrain-corrected backscatter, for example inundation or crop-area mapping. GSLC is useful when you need complex phase-preserving data on a map grid, but it is larger and more demanding. GUNW is the product to open when your question is deformation: did the ground move along the satellite line of sight between two acquisitions, and where is the measurement coherent enough to trust?
For India, users should also know the access split. NASA lists L-band access through the Alaska Satellite Facility, while Bhoonidhi provides S-band and L-band access over India and selected sites. ISRO's July 2026 NISAR S-band release says the S-band products are distributed through Bhoonidhi, with standard products such as L1-RSLC, L2-GSLC and L2-GCOV, plus interferometric products including L1-RIFG, L1-RUNW and L2-GUNW. ISRO also notes that Bhoonidhi provides an HDF to GeoTIFF utility and a QGIS-integrated SARPOL tool.
Worked example: Jharia in QGIS
Suppose your study question is: where should a field team inspect possible recent ground movement in and around the Jharia Coalfield? The aim is not to declare final subsidence rates from one pair. The aim is to create a clean, documented line-of-sight displacement screening layer that can guide a more serious time-series or field survey.
-
Define the area of interest around Jharia and Dhanbad. Keep it tight, around the coalfield rather than all of Jharkhand, because NISAR products are large and phase layers are easier to inspect when the first map is focused.
-
In Bhoonidhi or ASF, search for NISAR GUNW products that cover the area and acquisition period. Use L-band if you want the global NASA archive route through ASF, and use Bhoonidhi for Indian S-band products where available. Prefer the same orbit direction and product maturity for comparison. ASF warns that BETA and PROVISIONAL products should be mixed carefully because differences may come from processing changes rather than landscape change.
-
Download the HDF5 product or use the portal conversion tools to export only the needed layers. For a beginner QGIS workflow, export unwrapped phase, coherence, connected components and any available correction or mask layers. If you are using Bhoonidhi, its HDF to GeoTIFF tool can produce GeoTIFF or Cloud-Optimized GeoTIFF output with spatial subsetting.
-
Load the GeoTIFF layers in QGIS. Check the coordinate reference system, then add a basemap or Survey of India compatible reference layer if available for your project. Because GUNW is Level 2 and geocoded, it should overlay as a GIS raster, but always inspect roads, settlements and mine boundaries before analysis.
-
Convert unwrapped phase to line-of-sight displacement. ESA's SNAP Phase to Displacement documentation explains that after topographic and flat-Earth phase are removed, the remaining phase is proportional to displacement projected in the slant-range direction. A common working equation is:
LOS displacement = -1 * unwrapped_phase * wavelength / (4 * pi)
For NISAR L-band, use wavelength = 0.24 m. For S-band, use wavelength = 0.094 m. In QGIS Raster Calculator, an L-band expression would look like:
-1 * "unwrapped_phase@1" * 0.24 / (4 * 3.14159265)
This returns metres along the line of sight using the chosen sign convention. Multiply by 1000 if you want millimetres:
-1000 * "unwrapped_phase@1" * 0.24 / (4 * 3.14159265)
-
Mask low-quality areas. Use the coherence layer to remove pixels where the two acquisitions do not correlate well. Do not choose a universal threshold blindly. Start by testing several thresholds, for example 0.2, 0.3 and 0.4, then compare the retained pixels with land cover, mine areas, water bodies and steep slopes. Keep a note of the selected value in your map layout or methods table.
-
Symbolise with a diverging colour ramp centred on zero. Avoid a dramatic rainbow palette. A balanced blue-white-red or brown-white-green ramp makes it easier to see positive and negative movement without overstating noisy pixels. Set transparent NoData for masked areas.
-
Interpret clusters, not isolated pixels. In a mining landscape, look for spatially coherent patches that follow mine workings, spoil areas, settlement edges or known unstable zones. Isolated single-pixel spots may be unwrapping artefacts, shadow, layover, low coherence or residual atmospheric signal.
How to read the result
A GUNW displacement map is a line-of-sight measurement, not a direct vertical subsidence map. If a pixel shows movement away from or towards the satellite, that motion may include vertical and horizontal components. A coalfield collapse feature, a slope movement and thermal expansion of infrastructure can all affect radar phase differently.
This is why the first deliverable should be a screening map with confidence classes, not a final hazard declaration. A practical classification for a student project could be: high confidence where displacement is spatially clustered and coherence is high, medium confidence where the signal is clustered but coherence is moderate, and low confidence where the signal is scattered or close to water, layover or shadow.
Also remember the time interval. NISAR's GUNW nearest-neighbour products are based on 12-day pairs, so the map represents change between two acquisitions, not a multi-year trend. If your question is long-term subsidence, stack multiple pairs and build a time-series. The Jharia literature shows why this matters: seasonal deformation patterns can vary across different parts of the coalfield, and a single pair can miss that behaviour.
Common beginner mistake
The most common mistake is treating unwrapped phase as displacement without checking units, wavelength and quality masks. Phase is in radians. It becomes displacement only after applying the radar wavelength and the 4π radar path relation. A 24 cm L-band phase image and a 9.4 cm S-band phase image will not convert to the same displacement for the same phase value.
The second mistake is converting line-of-sight displacement directly to vertical subsidence by dividing by the cosine of an incidence angle found online. That shortcut assumes purely vertical motion and a correct local incidence angle. In a mined, fractured or sloping area, horizontal movement can be important. If you need vertical displacement, use a documented decomposition approach with ascending and descending observations, GNSS or levelling control.
The third mistake is making a beautiful map from a noisy interferogram. Coherence, connected components and known artefact zones are not optional. A good analyst removes weak evidence before styling the result.
Frequently asked questions
Is NISAR better than Sentinel-1 for subsidence mapping in India?
NISAR is not simply better, but it adds valuable L-band and S-band observations with a 12-day repeat cycle and India-focused S-band coverage. Sentinel-1 remains useful for long archives and established workflows. The strongest projects will compare sensors rather than replacing one with the other.
Which NISAR product should I open first in QGIS?
Open GUNW first if your question is ground deformation, because it is geocoded and includes unwrapped phase plus coherence layers. Open GCOV first if your question is backscatter mapping for water, crops or disturbance. GSLC is powerful but heavier for beginners.
Can one GUNW pair prove mining subsidence?
One GUNW pair can indicate possible movement, but it cannot prove mining subsidence by itself. Treat it as screening evidence. Reliable interpretation needs repeated pairs, coherence checks, mine-context layers and preferably field validation, GNSS, levelling or records from the concerned agencies.
Why does coherence matter so much?
Coherence tells you whether phase measurements from the two acquisitions remained correlated enough to support interpretation. Low coherence can come from vegetation change, water, excavation, decorrelation or processing limits. Masking weak coherence protects your map from confident-looking but unreliable displacement patterns.
References
- https://science.nasa.gov/mission/nisar/mission-overview/
- https://science.nasa.gov/mission/nisar/about-the-satellite/
- https://www.isro.gov.in/NISARS_Band_SAR_Data_Products_Release.html
- https://nisar-docs.asf.alaska.edu/products-overview/
- https://nisar-docs.asf.alaska.edu/gunw/
- https://step.esa.int/main/wp-content/help/versions/9.0.0/snap-toolboxes/org.esa.s1tbx.s1tbx.op.insar.ui/operators/PhaseToDisplacementOp.html
- https://isprs-annals.copernicus.org/articles/X-4-2024/349/2024/
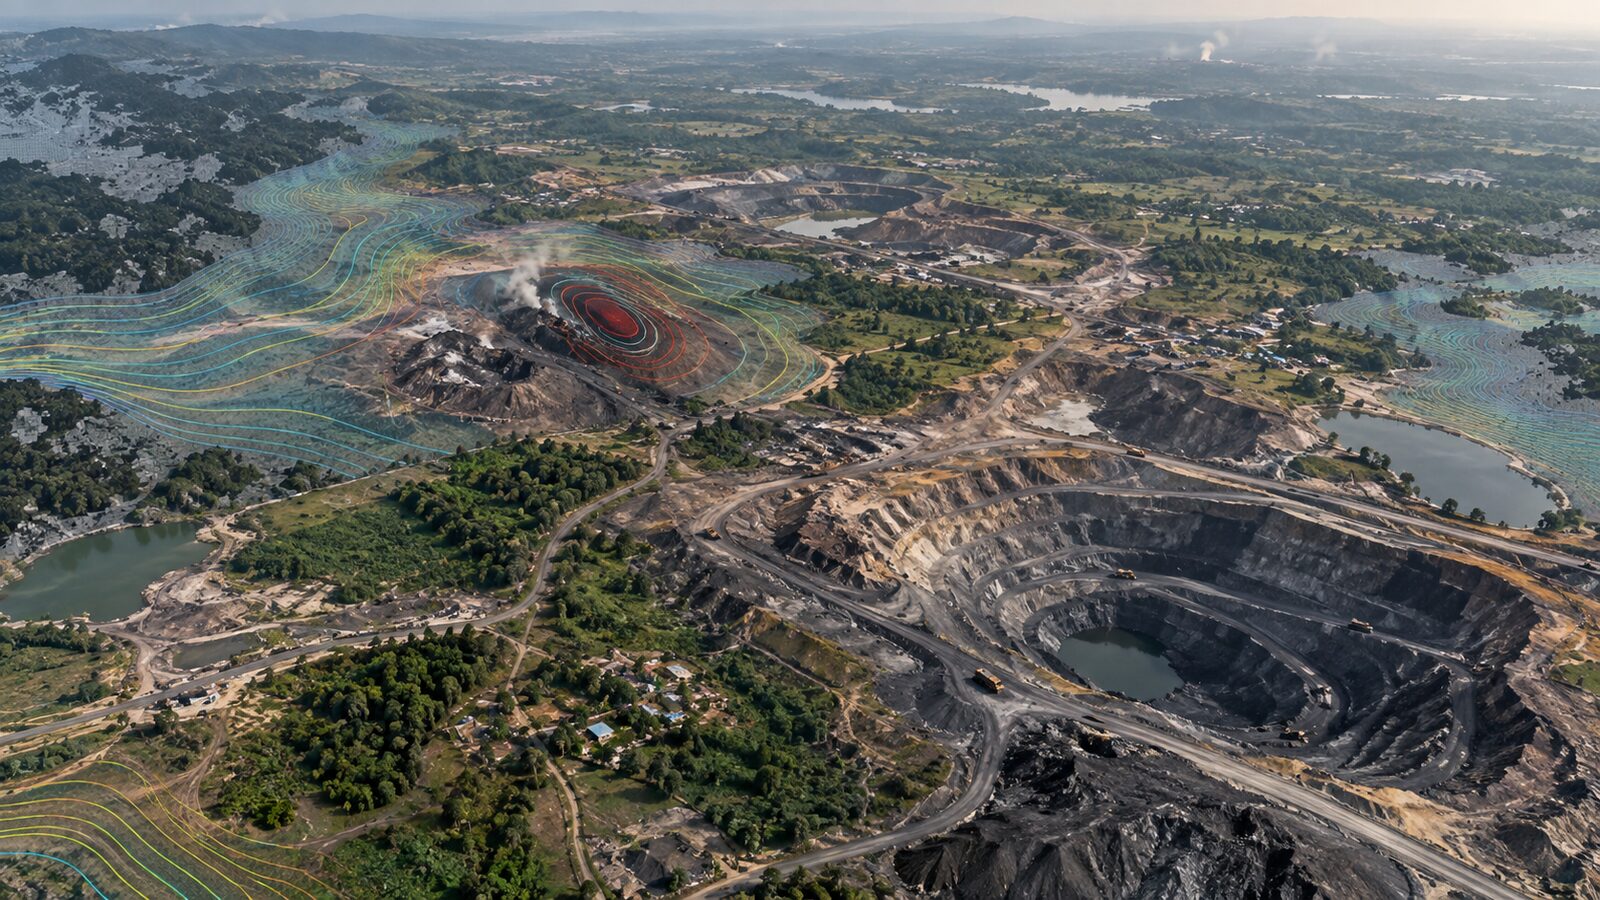
Cover image: AI-generated illustration (ChatGPT image generation), not satellite data.
Researched and drafted with AI assistance; sources are linked for verification.