Red Edge Indices for Crop Stress Detection: Beyond NDVI
Red edge indices like NDRE and CIre detect crop stress weeks before NDVI saturates — here is how to apply them on Sentinel-2 imagery for Indian wheat and rice fields.

Why NDVI Is No Longer Enough for Indian Agriculture
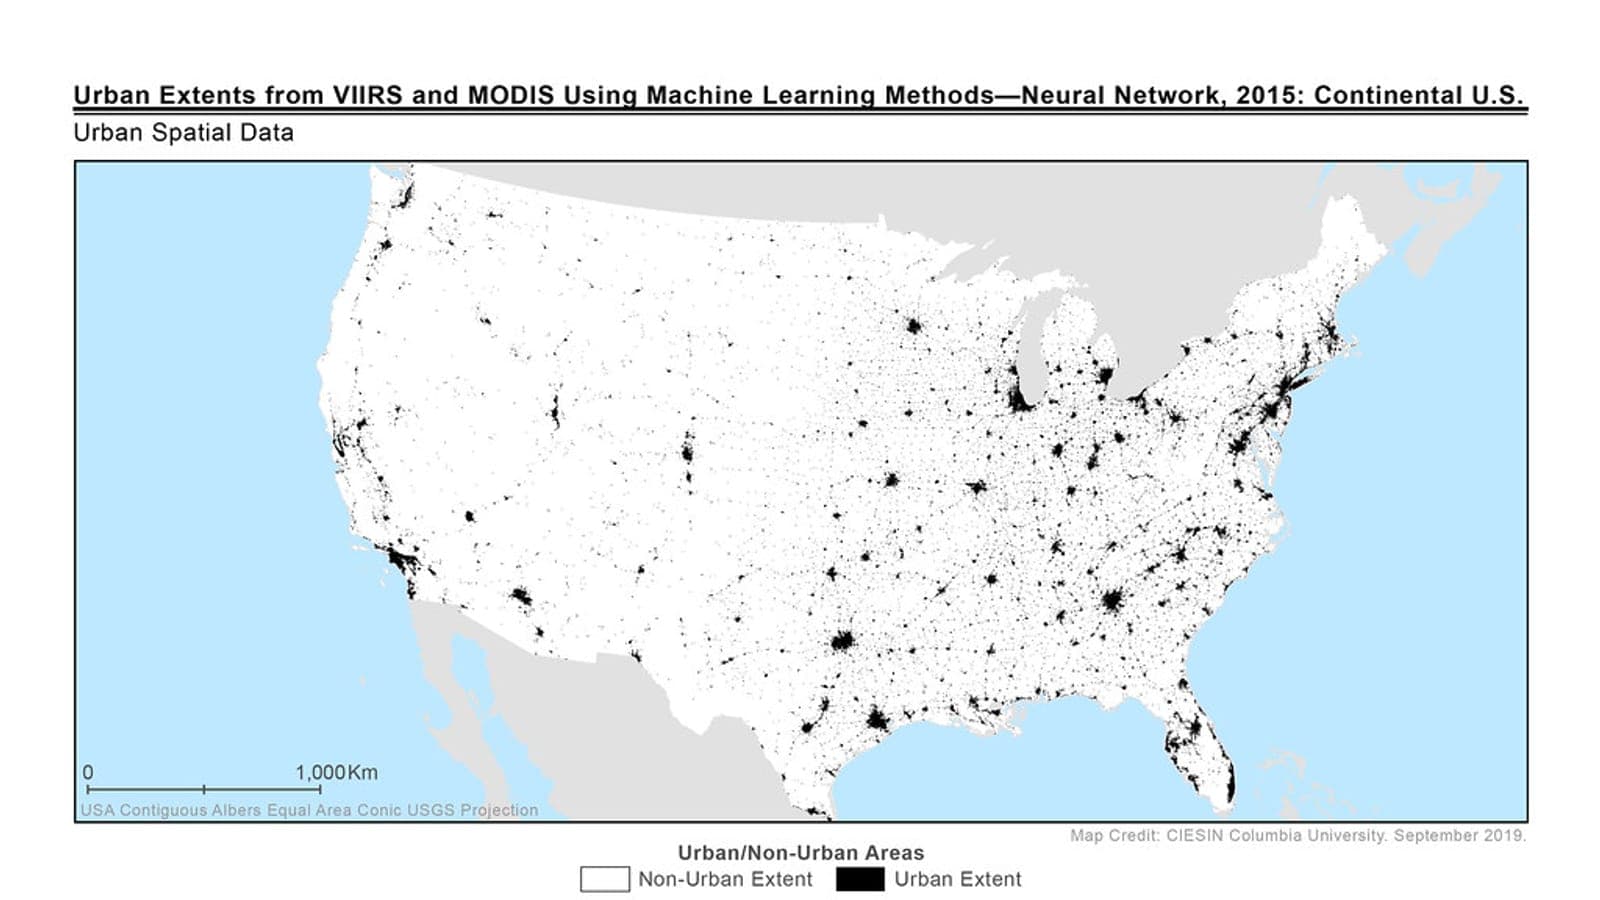
India's agricultural data infrastructure has grown dramatically. The government has already created over 7.63 crore Farmer IDs and surveyed 23.5 crore crop plots under its digital agriculture mission. AI-driven agri-advisory platforms are now translating satellite and sensor data into multilingual, real-time farm decisions. Variable rate technology (VRT) — which applies inputs at spatially variable rates based on field conditions — is gaining traction as a cost-reduction strategy.
All of this creates one pressing technical requirement: spectral indices that detect crop stress early, before it becomes visible to the naked eye or shows up clearly in NDVI. That is precisely where red edge indices come in.
What Is the Red Edge, and Why Does It Matter for Stress Detection?
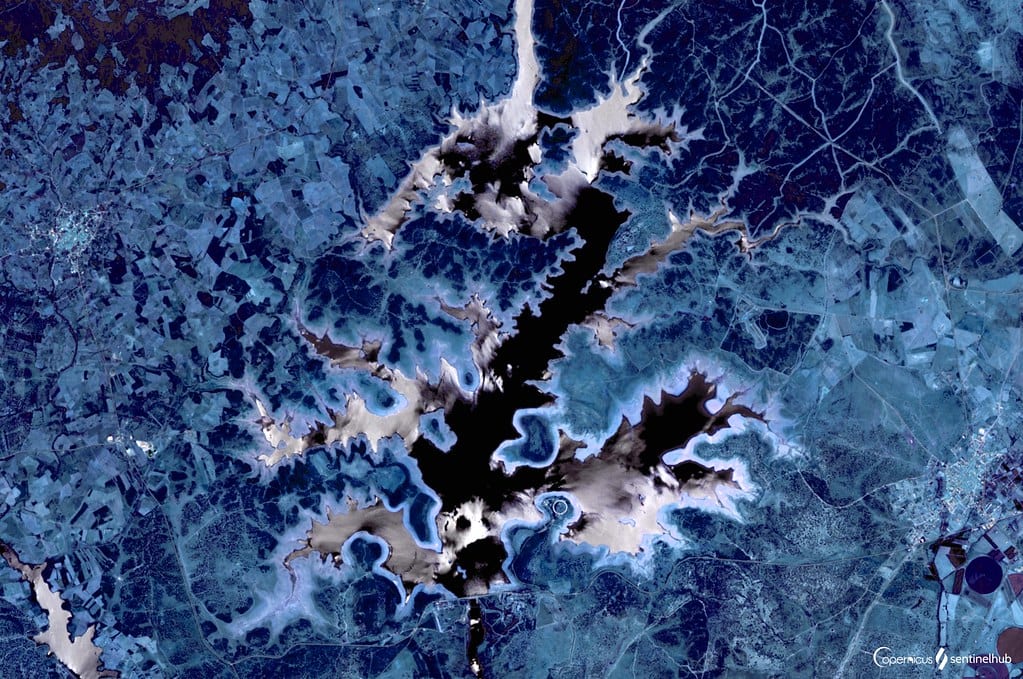
Illustrative: Sentinel-2 false color wheat field. "Gabriel y Galán Reservoar, Spain" by SentinelHub is licensed under CC BY 2.0. To view a copy of this license, visit https://creativecommons.org/licenses/by/2.0/.
The "red edge" refers to the steep rise in vegetation reflectance between roughly 700 nm and 740 nm — the boundary between the red wavelengths that chlorophyll absorbs strongly and the near-infrared wavelengths that leaf cell structure reflects. This transition is physiologically meaningful: as chlorophyll degrades under stress (nutrient deficiency, drought, pathogen attack), the red edge shifts and the slope flattens, often before any visible yellowing occurs.
NDVI uses red (~665 nm) and NIR (~842 nm) bands. At moderate-to-high canopy densities, NDVI saturates — it stops discriminating between a healthy dense canopy and a slightly stressed one. The red edge bands on Sentinel-2 (B5 at ~705 nm, B6 at ~740 nm, B7 at ~783 nm) sit right inside this physiologically sensitive zone and do not saturate as quickly, making them better suited for detecting differences in chlorophyll content across a dense wheat or rice canopy.
Key Red Edge Indices: Formulas and Interpretation
NDRE (Normalized Difference Red Edge)
$$NDRE = \frac{NIR - RedEdge}{NIR + RedEdge}$$
Using Sentinel-2 bands: (B8 − B5) / (B8 + B5). NDRE uses red-edge light that penetrates leaves more deeply than red light, making it more sensitive to chlorophyll concentration in the mesophyll layer. It is particularly useful mid-season when canopies are closed and NDVI has already plateaued.
MSAVI2 (Modified Soil-Adjusted Vegetation Index)
MSAVI2 minimises soil background noise — a significant advantage in Indian dryland contexts like Rajasthan or the Deccan Plateau where partial canopy cover is common. Studies comparing NDVI, NDRE, MSAVI, and NDSI confirm that MSAVI is valuable for early diagnosis of crop problems, especially in sparse-canopy stages.
CIre (Chlorophyll Index Red Edge)
$$CIre = \frac{NIR}{RedEdge} - 1$$
CIre has a near-linear relationship with leaf chlorophyll content, which makes it more interpretable for agronomic decision-making than a normalised ratio. A drop in CIre before NDVI drops is a reliable early-warning signal.
A Worked Example: Detecting Nitrogen Stress in a Wheat Field
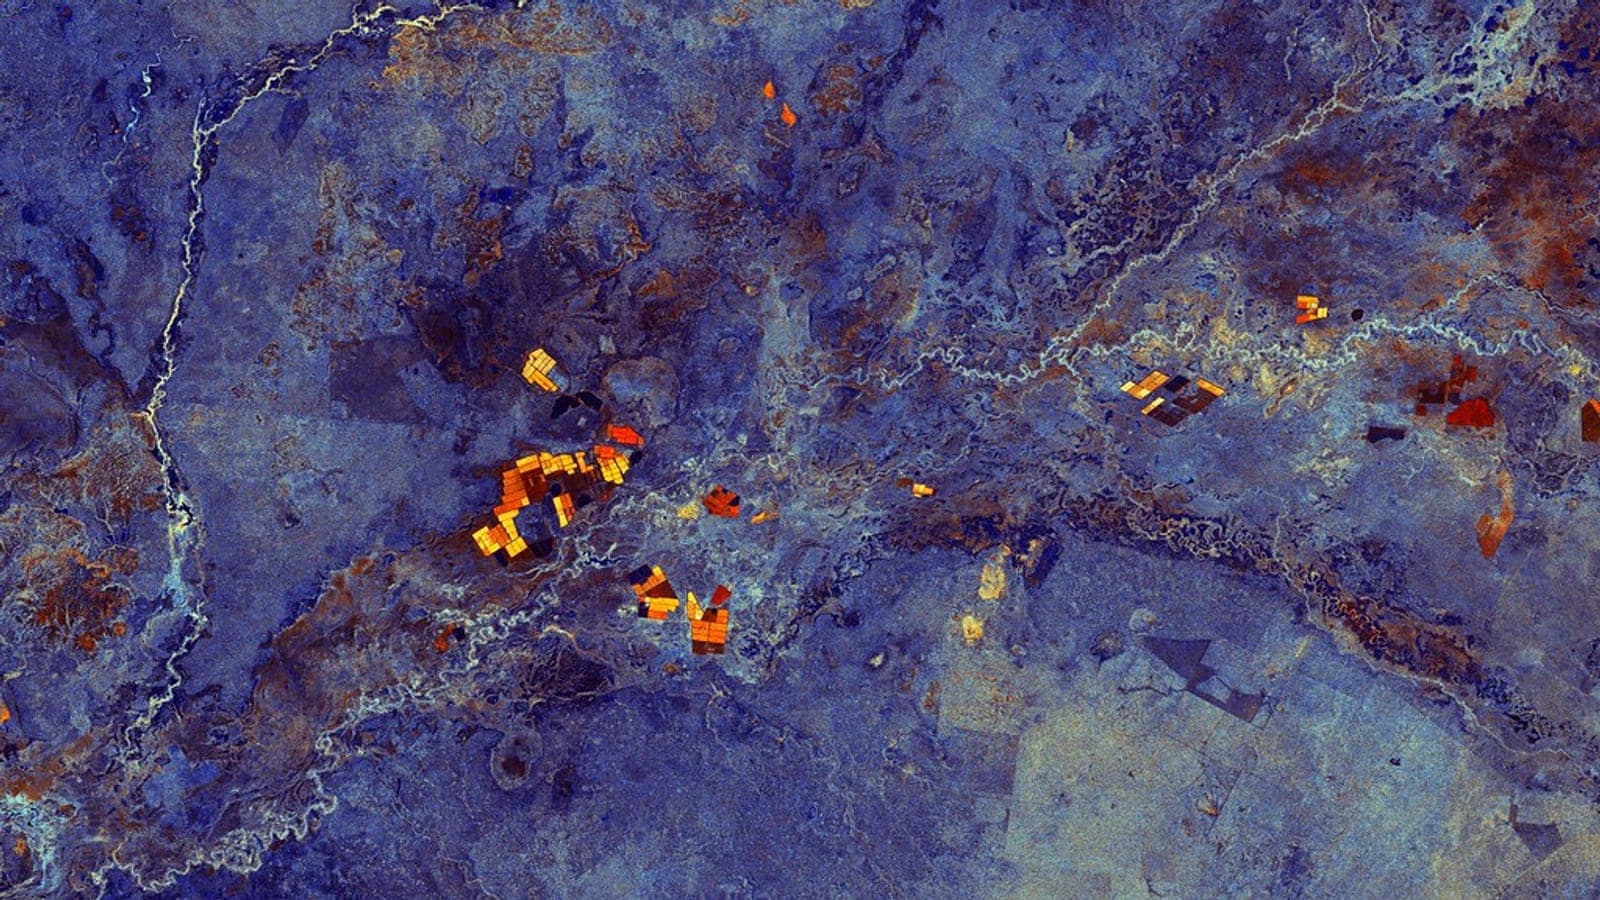
Illustrative: nitrogen stress crop canopy aerial. "Autumnal Explosives" by jurvetson is licensed under CC BY 2.0. To view a copy of this license, visit https://creativecommons.org/licenses/by/2.0/.
Consider a 10-hectare wheat plot in Haryana at the tillering stage (late November). You pull Sentinel-2 Level-2A imagery (10 m for B4/B8, 20 m for B5/B6/B7).
- Compute NDVI using B4 and B8. The field shows a uniform value of ~0.72 — apparently healthy.
- Compute NDRE using B5 and B8. You notice a 15% lower NDRE in the northwestern corner compared to the field average.
- Compute CIre using B7 and B5. The same corner shows a CIre value 20% below the field mean.
- Cross-check with MSAVI2 to confirm the signal is not soil-background noise from a bare patch.
The NDRE and CIre anomaly, invisible in NDVI, flags early nitrogen deficiency. A targeted soil sample from that corner confirms lower available N. This is exactly the kind of within-field variability that variable rate technology needs as an input to generate a prescription map — applying more urea only where it is needed, reducing input cost and environmental load.
When to Use Which Index: A Quick Decision Guide
| Situation | Recommended Index | Why |
|---|---|---|
| Dense closed canopy (rice, wheat at heading) | NDRE or CIre | NDVI saturates; red edge remains sensitive |
| Sparse/early-season canopy | MSAVI2 | Suppresses soil background signal |
| Nitrogen status monitoring | CIre | Near-linear with chlorophyll content |
| Land cover / crop-type classification | NDVI time series | Shown to improve overall classification accuracy |
| Early multi-stress diagnosis | NDRE + NDSI combined | NDSI and MSAVI useful alongside NDRE for early diagnosis |
One nuance worth flagging: research on NDVI vs NDRE for crop monitoring consistently shows that NDRE outperforms NDVI for chlorophyll-related stress, but NDVI's longer archive and broader sensor compatibility still make it the baseline for time-series analysis and crop health monitoring over seasons — as demonstrated in kharif season assessments in central India.
Practical Constraints in the Indian Context
A few realities to keep in mind when deploying red edge indices at scale in India:
- Sensor availability: Red edge bands are available on Sentinel-2 (free, 5-day revisit at 20 m) and on commercial platforms like Planet's SuperDove. RESOURCESAT-2A (AWiFS, LISS-III) does not carry dedicated red edge bands, which limits operational use in legacy ISRO workflows.
- Cloud cover: Kharif season (June–October) is heavily cloud-affected across most of India. Time-series gap-filling or SAR fusion (Sentinel-1 C-band) is often necessary — SAR-based crop health assessment has been validated for kharif conditions in central India.
- Mixed pixels at 20 m: India's average landholding is small. At 20 m resolution, red edge bands can mix signals from adjacent plots. UAV-based studies at higher resolution highlight the role of spectral optimisation in improving stress detection accuracy — a relevant consideration for demonstration plots or high-value horticulture.
- Integration with AI advisory tools: Platforms like Terra Oracle AI are already ingesting multi-source farm data. Feeding NDRE or CIre as a feature alongside soil data and weather inputs should improve the agronomic recommendation quality compared to NDVI alone.
The Thar Desert case is also instructive: four decades of agricultural expansion in the region have created landscapes where soil salinity and waterlogging stress co-exist with irrigation-driven greenness — exactly the scenario where NDVI's inability to distinguish "green but stressed" from "green and healthy" is a real operational problem. Red edge indices, combined with NDWI, offer a more diagnostic picture.
Getting Started in Google Earth Engine
For practitioners wanting to test this immediately, Sentinel-2 SR (COPERNICUS/S2_SR_HARMONIZED) in GEE exposes B5, B6, B7, and B8A as red edge and NIR bands. A minimal NDRE computation looks like:
var ndre = image.normalizedDifference(['B8', 'B5']).rename('NDRE');
Pair this with a time series chart over your study area across a crop season to see the divergence between NDVI and NDRE signals during stress events — it is often the most convincing demonstration for a field agronomist or a VRT service provider.
References
- Press Information Bureau — Digital Agriculture Mission, Farmer IDs and Crop Plot Survey
- AgriBusiness Global — Variable Rate Technology: Economic Benefits and Future Growth
- Agro Spectrum India — Can AI stabilise India's climate-stressed agriculture?
- Times of India — Thar Desert's green revolution
- Hortidaily — AI agronomic advisor, Terra Oracle AI
- ResearchGate — Comparison of NDVI, NDRE, MSAVI and NDSI for Early Diagnosis of Crop Problems
- PMC — Reinforcement learning based dynamic vegetation index formulation
- MDPI Remote Sensing — Land Cover and Crop Classification Based on Red Edge Indices
- Auravant — Vegetation indices: NDVI, GNDVI, MSAVI2, NDRE, NDWI
- Leaf Agriculture — NDVI vs NDRE
- Journal IMCMS — Comparison of NDVI and NDRE to Detect Differences in Vegetation and Chlorophyll Content
- Springer — Crop health assessment using Sentinel-1 SAR time series, central India
Researched with AI assistance and reviewed by Jannat Khosla.
Hero image: "Toronto by Sentinel-2 (cropped)" by Copernicus Sentinel-2, ESA is licensed under CC BY-SA 3.0. To view a copy of this license, visit https://creativecommons.org/licenses/by-sa/3.0/igo/deed.en/.