SAR Flood Mapping with Sentinel-1: How It Works and Why It Matters for India
SAR flood mapping with Sentinel-1 works through microwave backscatter contrast between water and land — and with India's new ISRO-Jal Shakti MOU, it is moving from research into operational policy. Here is how the technique actually works, step by step.
Why This Matters Right Now
On 1 June 2026, India's Ministry of Jal Shakti and ISRO formally signed a Memorandum of Understanding in New Delhi, committing to use satellite-based geospatial tools for water resource monitoring and management. Alongside this, the Ministry launched the MAHA on Water mission at a national R&D workshop, signalling that space-based hydrology is no longer a research curiosity — it is becoming operational policy.
For GIS and remote sensing professionals in India, this is a direct career signal. One of the most mature and immediately deployable tools in this space is SAR flood mapping with Sentinel-1. If you are entering this field — or trying to position yourself for work with ISRO, state disaster management authorities, or consultancies — understanding how this technique actually works, not just that it exists, is essential.
What Makes SAR Different from Optical Imagery for Flood Mapping?
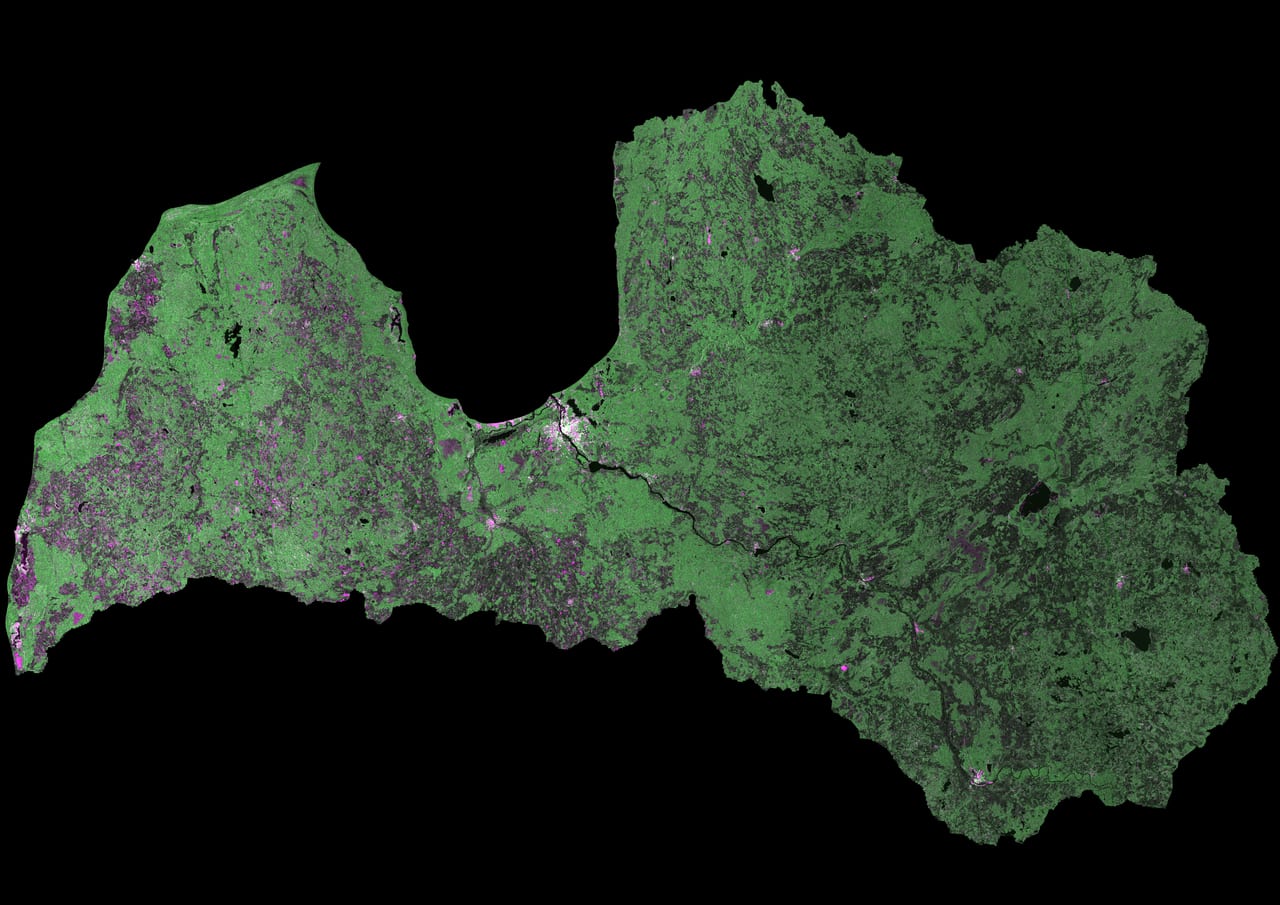
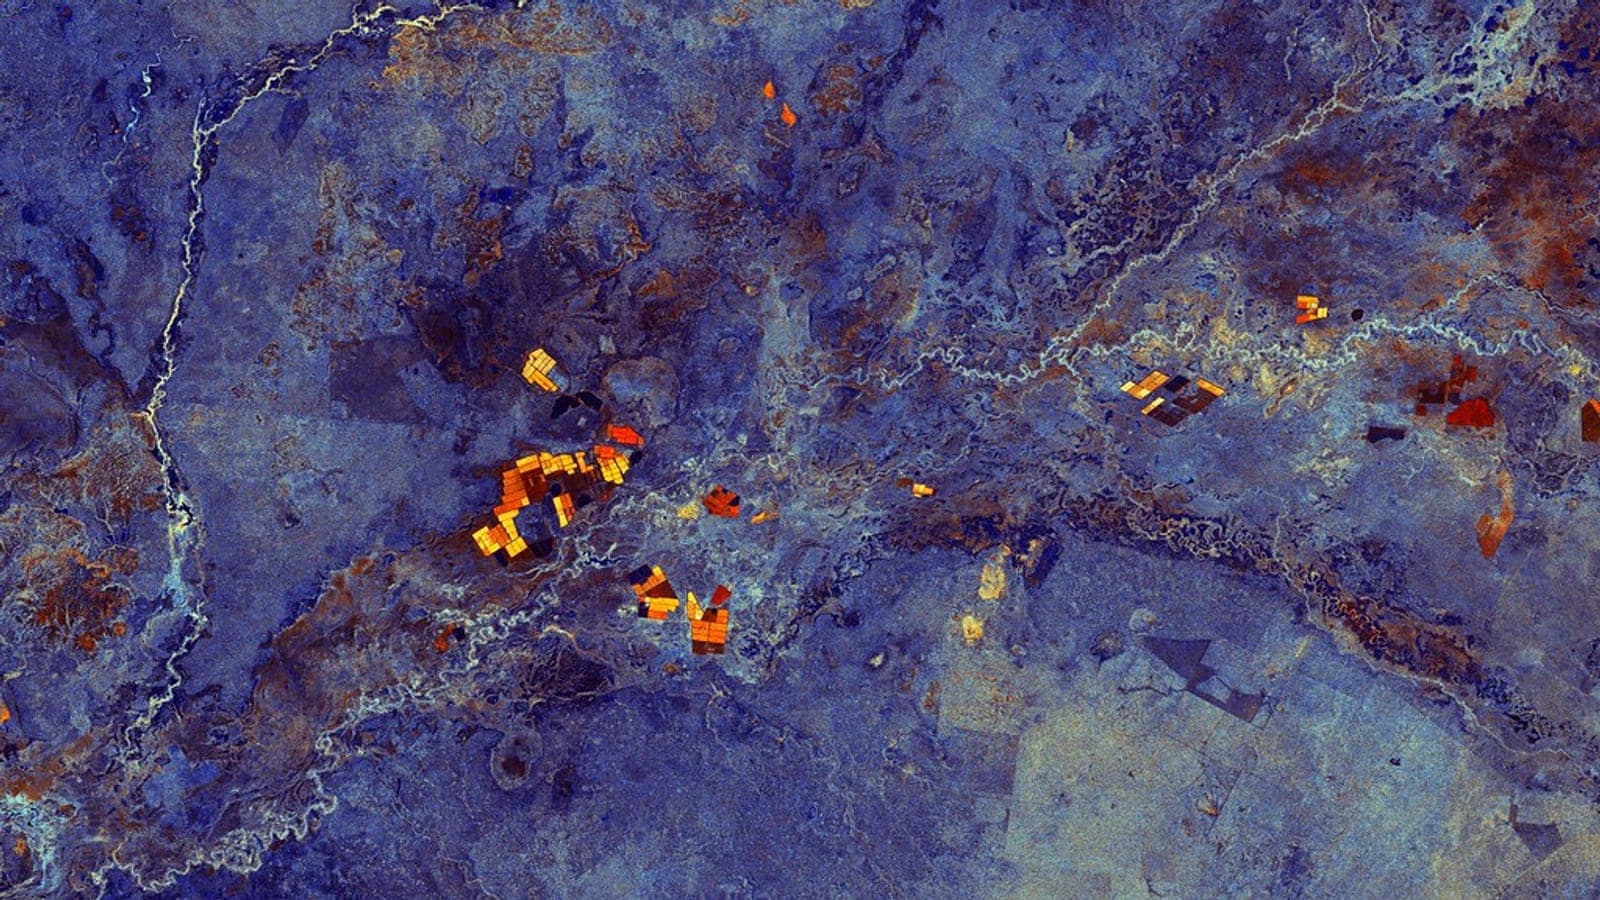
Illustrative: Sentinel-1 SAR flood inundation map. "Latvijas teritorija Sentinel-1 SAR datu mozaīkā" by VoldemarsSkuja is licensed under CC BY-SA 4.0. To view a copy of this license, visit https://creativecommons.org/licenses/by-sa/4.0/.
Most students learn flood mapping using optical sensors — LISS, Landsat, Sentinel-2. The logic is intuitive: water absorbs near-infrared, so flooded areas appear dark. The problem is equally intuitive: clouds. India's flood season is the monsoon. Cloud cover during peak inundation events is near-total, which makes optical imagery nearly useless precisely when you need it most.
Synthetic Aperture Radar (SAR) transmits its own microwave pulses and records the backscatter. Microwaves penetrate clouds and rain (with some attenuation at higher frequencies), which means Sentinel-1 can provide systematic, weather-independent imagery regardless of monsoon cloud cover. This is not a marginal advantage — it is the entire reason SAR flood mapping has become the standard approach for near-real-time disaster response.
Sentinel-1 operates in C-band (approximately 5.4 GHz). Over open water, the smooth surface causes specular reflection — microwave energy bounces away from the sensor, returning very low backscatter. On land, rough surfaces scatter energy back. This contrast is the physical basis of flood detection.
How Does the Detection Actually Work? A Step-by-Step View
Here is a simplified but technically honest walkthrough of a standard SAR flood mapping workflow, the kind you would implement in Google Earth Engine or SNAP:
-
Acquire pre- and post-flood Sentinel-1 GRD scenes (Ground Range Detected, IW mode, VV or VH polarisation). VV polarisation is generally preferred for open water; VH can help in vegetated areas where double-bounce complicates VV response.
-
Apply preprocessing: orbit file correction, radiometric calibration, speckle filtering (Lee or Refined Lee filters are common), and terrain correction using a DEM (SRTM 30m works for most Indian plains contexts).
-
Convert to decibels: backscatter values are log-transformed to σ° in dB. Flooded open water typically falls below −15 to −20 dB in VV.
-
Apply a threshold: pixels below a defined backscatter threshold are classified as water. This is where most of the methodological debate lives — fixed thresholds fail across heterogeneous landscapes, so adaptive or Otsu-based thresholding is preferred.
-
Mask out permanent water bodies using a reference dataset (JRC Global Surface Water is the standard choice) so you are mapping flood extent, not just water presence.
-
Validate against ground truth, high-resolution imagery, or gauge data.
UN-SPIDER's recommended practice follows exactly this structure and is freely available — it is a good starting point for anyone building their first flood map in GEE.
What Accuracy Can You Realistically Expect?
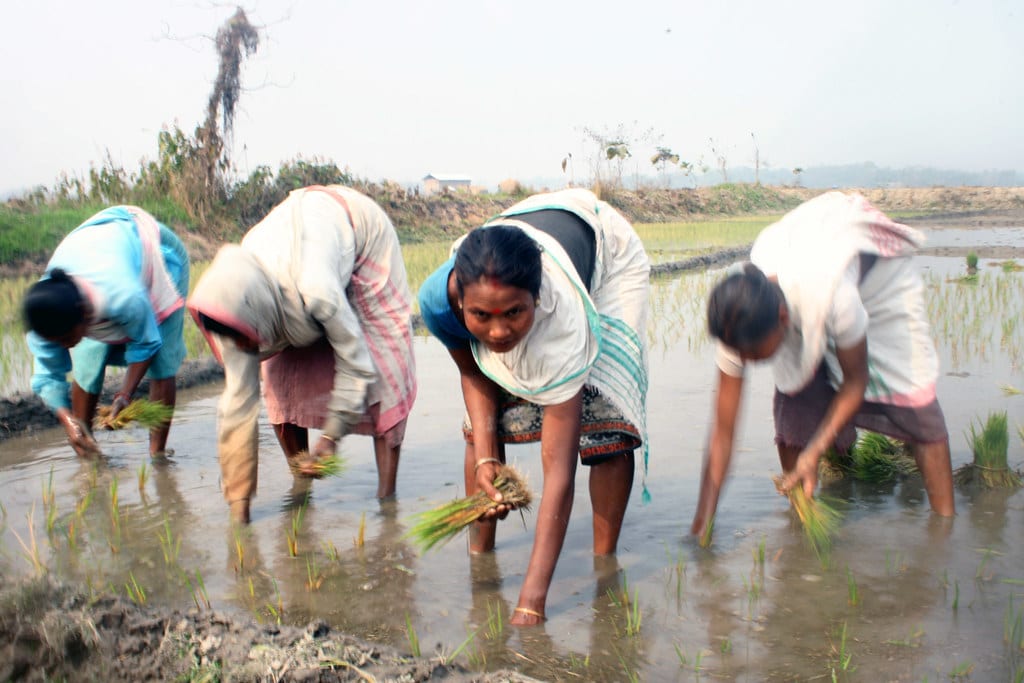
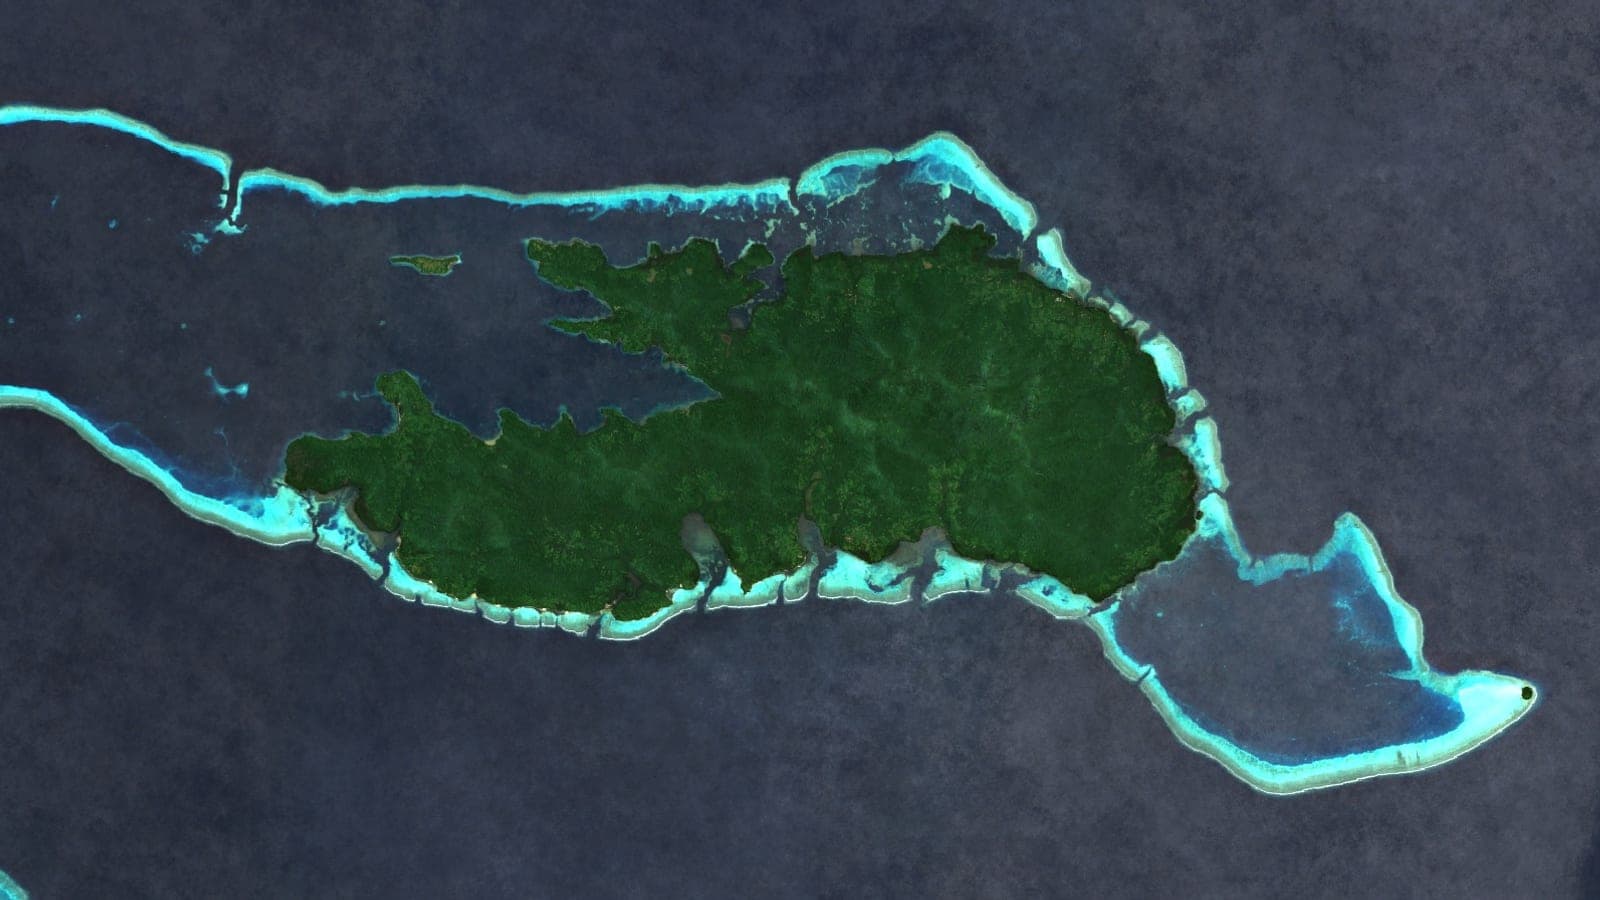
Illustrative: monsoon flooding Indian plains aerial. "Cultivation" by Diganta Talukdar is licensed under CC BY 2.0. To view a copy of this license, visit https://creativecommons.org/licenses/by/2.0/.
This is a question I get asked often, and the honest answer is: it depends heavily on landscape type, flood depth, and vegetation cover — but the numbers from peer-reviewed work are encouraging.
A study on the 2018 Bihar/Patna monsoon floods using Sentinel-1 SAR flood inundation maps reported overall accuracies of 94.3% and 94.1% for images acquired on 9th and 21st August 2018 respectively. A separate study on advanced SAR classification methods using Sentinel-1A reported an overall accuracy of 90%, with producer and user accuracy for flood-affected areas around 92%.
A comparative analysis of classification techniques found that K-means and Random Forest approaches consistently outperformed simpler thresholding methods, reaching maximum accuracies of 97.87% and 97.36% respectively. This suggests that if you are building a more sophisticated pipeline — say, for a state SDMA or a river basin authority — moving beyond simple thresholding toward ML-based classification is worth the added complexity.
The caveats matter too. SAR struggles with:
- Dense vegetation canopy: the canopy masks the water surface below, causing underestimation of flood extent in forested or paddy areas
- Urban areas: double-bounce from buildings creates high backscatter that can mask flooded pixels
- Very shallow flooding (< ~10 cm): insufficient contrast against dry soil
The India Context: Where SAR Flood Mapping Is Already Being Used
India's flood exposure is among the highest in the world. The Brahmaputra, Ganga, and their tributaries flood extensively every monsoon season. ISRO's National Remote Sensing Centre (NRSC) has been producing flood inundation maps operationally for years, and multi-sensor satellite data has been studied for Indian flood-prone regions across multiple major river systems.
The new ISRO–Jal Shakti MoU is significant because it formalises what was previously ad hoc — satellite data will now feed into structured water security planning, including flood monitoring. The MAHA on Water mission is intended to drive this integration further, connecting space observation to on-ground water management decisions.
For practitioners, this means demand for people who can actually process Sentinel-1 data, interpret outputs critically, and communicate uncertainty to non-technical decision-makers is going to grow.
The Fully Automatic Global Flood Monitoring Service — and What It Means for Local Work
The Copernicus Emergency Management Service's fully-automatic Sentinel-1 Global Flood Monitoring service now provides near-real-time flood maps globally without human intervention. This is genuinely impressive infrastructure. But it also creates a misconception I want to address directly: automated global products are not a substitute for locally calibrated analysis.
Global services use generalised thresholds and reference datasets. For a specific river floodplain in Assam or a coastal inundation event in Odisha, local DEM quality, land cover, and flood dynamics matter enormously. A GIS professional who can take the global product as a first pass and then refine it using local knowledge, better DEMs, and field validation adds real value that an automated pipeline cannot.
This is the skill gap worth filling.
Getting Started: Practical Entry Points
If you want to build hands-on competence in SAR flood mapping Sentinel-1 workflows:
- Google Earth Engine has Sentinel-1 GRD data ingested and preprocessed. The UN-SPIDER step-by-step guide linked above is the fastest path to a working script.
- ESA SNAP is free and handles the full preprocessing chain — useful for understanding what GEE is doing under the hood.
- QGIS with the Semi-Automatic Classification Plugin can handle post-processing and accuracy assessment.
- Look at the Lund University thesis integrating Sentinel-1 with hydraulic modelling for a model of how to combine SAR outputs with HEC-RAS or similar tools — increasingly relevant as Indian river basin authorities move toward integrated flood forecasting.
References
- India turns to satellite technology and mission-driven research to tackle water security — Smart Water Magazine
- Water R&D Workshop Launches MAHA Mission and ISRO Partnership — The Policy Edge
- Centre Signs MoU with ISRO for Water Research — GK Today
- ISRO, Jal Shakti Join Hands to Track and Save Water from Space — Indianweb2.com
- The fully-automatic Sentinel-1 Global Flood Monitoring service — Remote Sensing of Environment
- Comparative analysis of classification techniques for flood mapping — Environmental Earth Sciences
- Quantifying Spatiotemporal Variability of Patna's 2023 Monsoon — ISPRS Archives
- Flood Mapping and Damage Assessment Using Sentinel-1 SAR — UN-SPIDER
- Enhancing Flood Area Mapping Accuracy Using Advanced SAR Techniques — IJECC
- Potentiality of multi-sensor satellite data in mapping flood hazard — Springer
- From Space to Safety: Flood Mapping with Sentinel-1 SAR Data — Lund University
Researched with AI assistance and reviewed by Jannat Khosla.