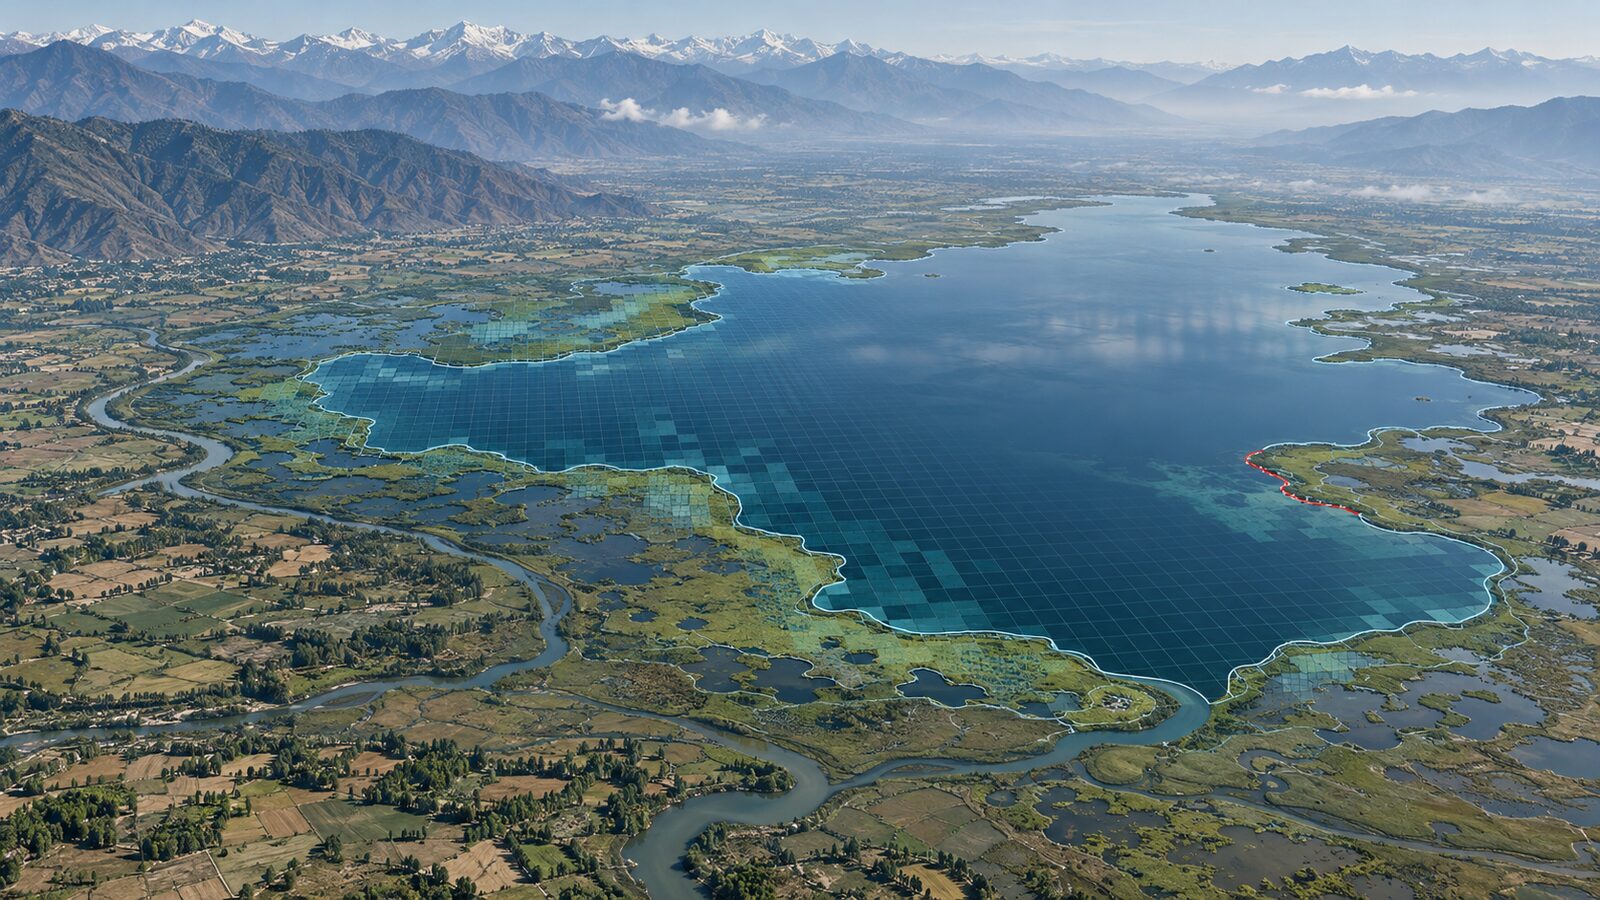
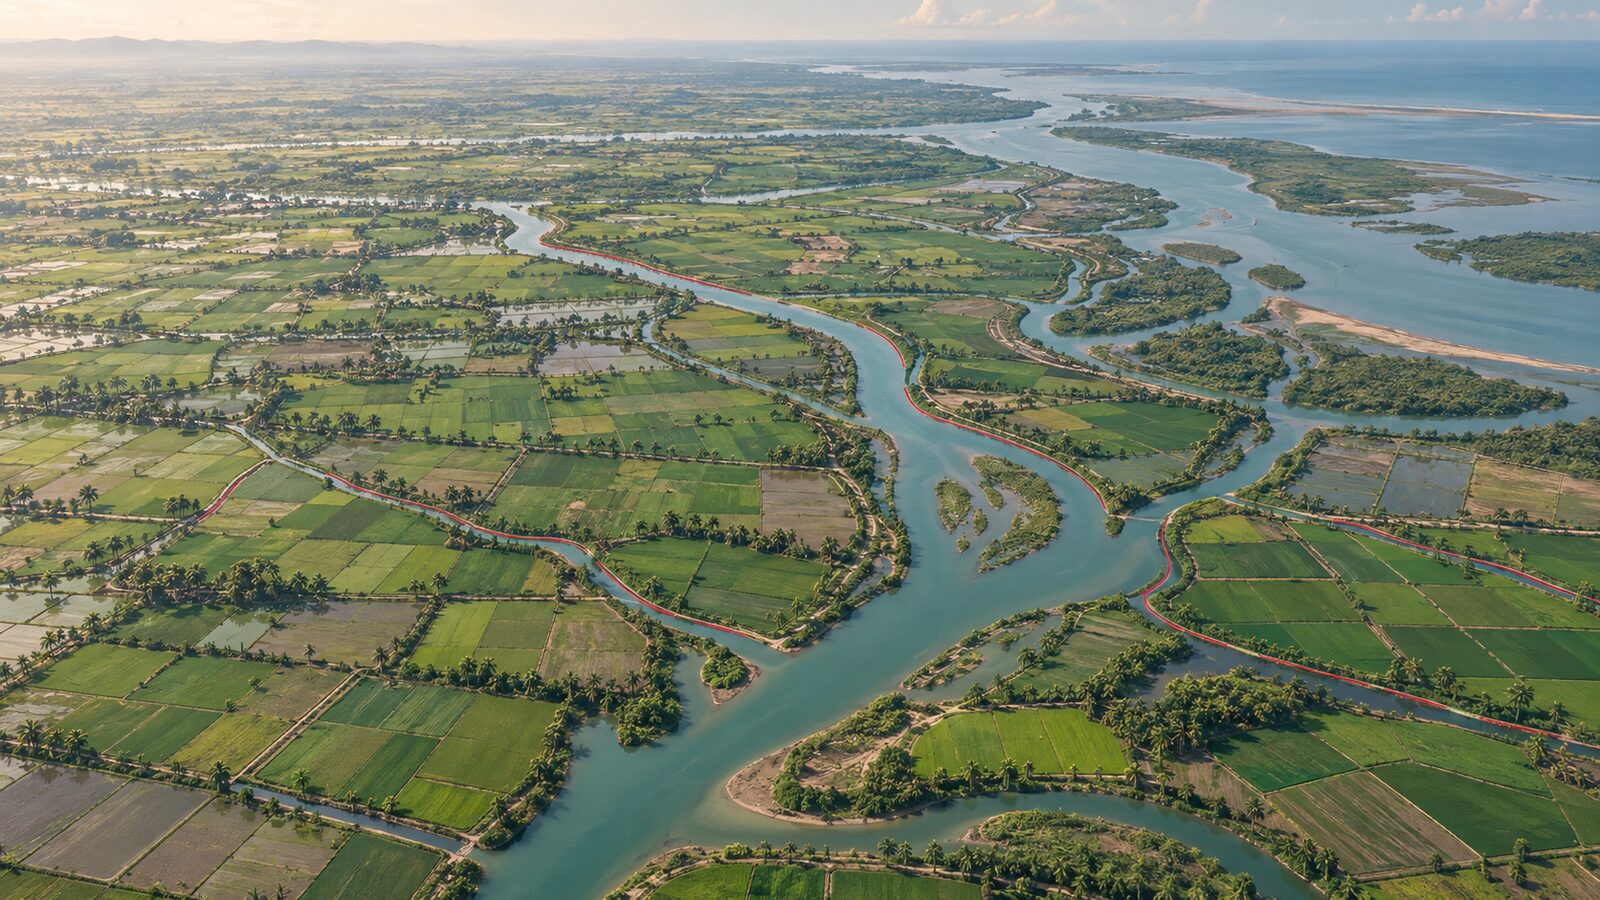
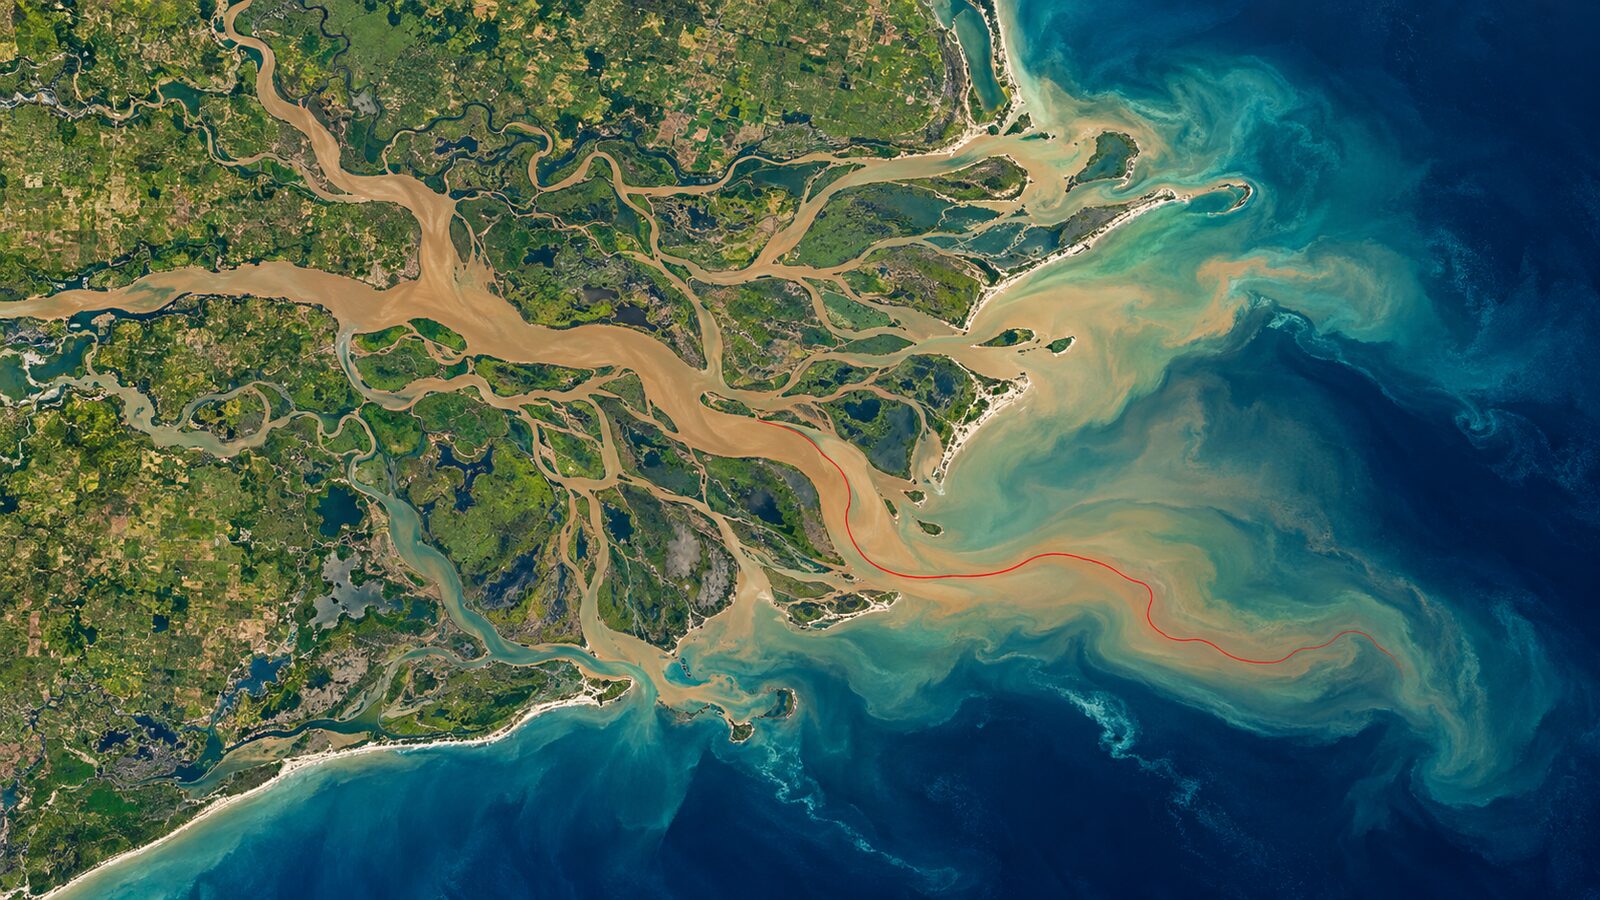
Crop Water Stress Mapping with Sentinel-2 NDWI and NDRE in GEE
NDVI lags crop water stress by days that cost yield. This article shows how to map early stress across the Indo-Gangetic Plain using Sentinel-2 NDWI and NDRE in Google Earth Engine, with step-by-step GEE code.
Why NDVI Alone Leaves You a Week Behind
Every rabi season, the same conversation happens in irrigation departments and agri-advisory offices across the Indo-Gangetic Plain: by the time the crop looks stressed in a field visit, or even in an NDVI time series, the yield damage is already done. Stomatal closure, reduced turgor, and impaired photosynthesis begin well before chlorophyll content drops enough to register in the red-NIR contrast that NDVI measures.
This is the core problem with stopping at NDVI for crop water stress remote sensing: it is a greenness index, not a moisture index. Sentinel-2's spectral design gives us two better tools for catching stress earlier, the Normalized Difference Water Index (NDWI) and the Normalized Difference Red Edge index (NDRE), and Google Earth Engine (GEE) makes it practical to compute both at field scale across an entire district in minutes.
What NDWI and NDRE Actually Measure (and Why They Differ from NDVI)
NDWI uses the green band and the near-infrared band to estimate the liquid water content held in leaf tissue. When a plant begins to lose turgor, the first physiological response to water deficit, the water content of mesophyll cells drops, and this shows up in the NIR reflectance before the leaf turns yellow or curls visibly. The formula using Sentinel-2 bands is:
NDWI = (B3 − B8) / (B3 + B8)
Values range roughly from −1 to +1; well-watered crops typically sit in the positive range, while stressed or dry vegetation moves negative.
NDRE uses the red-edge band (B5, centred around 705 nm on Sentinel-2) and the NIR band (B8A):
NDRE = (B8A − B5) / (B8A + B5)
The red-edge region is exquisitely sensitive to chlorophyll concentration changes that occur early in water stress, before the broadband red reflectance used in NDVI shifts noticeably. Think of NDRE as catching the plant's early warning signal, while NDVI catches the full alarm.
Used together, NDWI flags tissue-level water loss and NDRE flags the early chlorophyll response. NDVI, by contrast, is most useful for tracking canopy density and overall biomass, valuable, but lagging.
Setting Up the GEE Workflow for the Indo-Gangetic Plain
The Indo-Gangetic Plain is an ideal test bed: large, relatively flat fields, a well-defined rabi season (sown October–November, harvested March–April), and significant spatial variability in irrigation access between canal-irrigated and groundwater-dependent zones.
Here is a practical step-by-step approach in GEE:
-
Define your area of interest (AOI). Draw a polygon over your district of interest, or import a district boundary shapefile via GEE Assets.
-
Filter the Sentinel-2 Surface Reflectance collection. Use
COPERNICUS/S2_SR_HARMONIZED. Filter by date (e.g., January–February for peak rabi stress risk), by your AOI, and by cloud cover (CLOUDY_PIXEL_PERCENTAGE < 20). -
Apply the cloud mask. Use the
QA60band to mask cloud and cirrus pixels. This step is non-negotiable in winter months when fog and haze over the IGP can corrupt entire scenes. -
Compute the indices.
var ndwi = image.normalizedDifference(['B3', 'B8']).rename('NDWI');
var ndre = image.normalizedDifference(['B8A', 'B5']).rename('NDRE');
var ndvi = image.normalizedDifference(['B8', 'B4']).rename('NDVI');
var composite = image.addBands([ndwi, ndre, ndvi]);
-
Create a median composite over a 15–20 day window to reduce noise from single-date anomalies.
-
Visualise and threshold. Display NDWI with a diverging palette (red for low, blue for high). Pixels with NDWI below a chosen threshold (commonly 0 for vegetated areas) and NDRE below a site-calibrated threshold flag potential stress zones.
-
Export to Drive or display in the GEE console for field verification planning.
A Worked Interpretation: Reading a Stress Map
Imagine you have generated a mid-January composite over a wheat-growing district in western Uttar Pradesh. Your NDWI layer shows a clear spatial pattern: fields along the canal command area cluster in the 0.1–0.3 range, while fields in the eastern tail-end zone and rainfed patches drop to −0.1 to −0.2.
Your NDRE layer reinforces this: the same tail-end fields show NDRE values noticeably lower than canal-head fields, suggesting early chlorophyll stress is already beginning even though the NDVI map looks relatively uniform across the district.
This divergence - NDWI and NDRE flagging stress while NDVI remains flat, is exactly the early-warning window that makes these indices operationally useful. An irrigation scheduler seeing this pattern has roughly a week to ten days to prioritise water release to tail-end distributaries before yield loss becomes measurable.
What to watch for in your own maps:
- Spatially coherent low-NDWI patches that align with field boundaries → likely actual crop stress, not noise
- Random salt-and-pepper low values → residual cloud shadow or mixed pixels; go back and tighten your cloud mask
- Low NDWI but normal NDRE → possible soil moisture signal from bare or sparse canopy areas; apply an NDVI threshold (e.g., NDVI > 0.3) to restrict analysis to vegetated pixels only
- Low NDRE but normal NDWI → early nutrient stress or pest damage can mimic this; cross-check with field reports
Limitations to Keep in Mind
No index works in isolation, and being honest about limitations is part of doing rigorous work.
Atmospheric effects are significant over the IGP in winter. Even surface reflectance products carry residual aerosol and haze errors; a single anomalously hazy date can pull your composite values down. Always inspect the QA bands and consider a stricter cloud/haze filter.
Spatial resolution trade-offs. Sentinel-2 gives you 10 m for B3 and B8 (NDWI) but B5 and B8A (needed for NDRE) are 20 m. GEE resamples automatically, but you should be aware that NDRE is effectively at 20 m native resolution, still excellent for field-level work, but worth noting when comparing with 10 m NDWI outputs.
Index saturation. In densely vegetated, well-irrigated fields, NDWI and NDRE can saturate and lose sensitivity. They are most discriminating in the moderate-to-low vegetation density range, which is precisely where early-season or stressed crops sit.
Ground truth is irreplaceable. Remote sensing indices are proxies. Before using any stress map for irrigation advisory, validate with at least a sample of field observations or soil moisture measurements.
Where to Take This Next
Once you are comfortable with single-date or composited stress maps, the natural next step is a time-series approach: track NDWI and NDRE at weekly intervals through the rabi season and flag pixels where values drop sharply relative to a baseline (e.g., the same week in a non-stressed reference year). This anomaly-detection framing is more robust than absolute thresholds and is how operational agricultural drought monitoring systems are typically designed.
You can also layer in LST (Land Surface Temperature) from Landsat or MODIS as a complementary thermal stress indicator, high LST combined with low NDWI is a strong combined signal of water stress.
For those working in state agriculture departments or with ISRO's National Agricultural Drought Assessment and Monitoring System (NADAMS) data, Sentinel-2 derived indices can serve as a high-resolution complement to the coarser operational products, helping disaggregate district-level assessments to the sub-tehsil or even village level.
The tools are free, the data is free, and the rabi season waits for no one.
Frequently asked questions
Why does NDVI detect crop water stress later than NDWI or NDRE?
NDVI is a greenness index, not a moisture index, so it only drops once chlorophyll falls, after stomatal closure and turgor loss have begun. NDWI and NDRE flag tissue water loss and early chlorophyll change first, giving roughly a week to ten days to act before yield loss becomes measurable.
What Sentinel-2 bands are used to calculate NDWI for crop water stress?
NDWI is calculated using the green band (B3) and the near-infrared band (B8), with the formula NDWI = (B3 − B8) / (B3 + B8). Well-watered crops typically sit in the positive range, while stressed vegetation moves negative.
What NDVI threshold helps avoid false stress readings from bare soil?
Applying an NDVI threshold above 0.3 restricts stress mapping to vegetated pixels only, since low NDWI over bare or sparse canopy areas can actually reflect a soil moisture signal rather than crop stress.
Why is NDRE's effective resolution coarser than NDWI's in Sentinel-2 data?
NDRE uses bands B5 and B8A, which are native at 20 m resolution, whereas NDWI uses the 10 m bands B3 and B8. Google Earth Engine resamples automatically, but NDRE remains effectively 20 m resolution.
References
- Google Earth Engine Data Catalog - Sentinel-2 MSI Surface Reflectance: https://developers.google.com/earth-engine/datasets/catalog/COPERNICUS_S2_SR_HARMONIZED
- ESA Sentinel-2 User Handbook (band specifications and resolution details): https://sentinel.esa.int/web/sentinel/user-guides/sentinel-2-msi
- ISRO NADAMS (National Agricultural Drought Assessment and Monitoring System): https://nadams.sac.gov.in
- GEE JavaScript API Documentation: https://developers.google.com/earth-engine/guides
Researched and drafted with AI assistance.
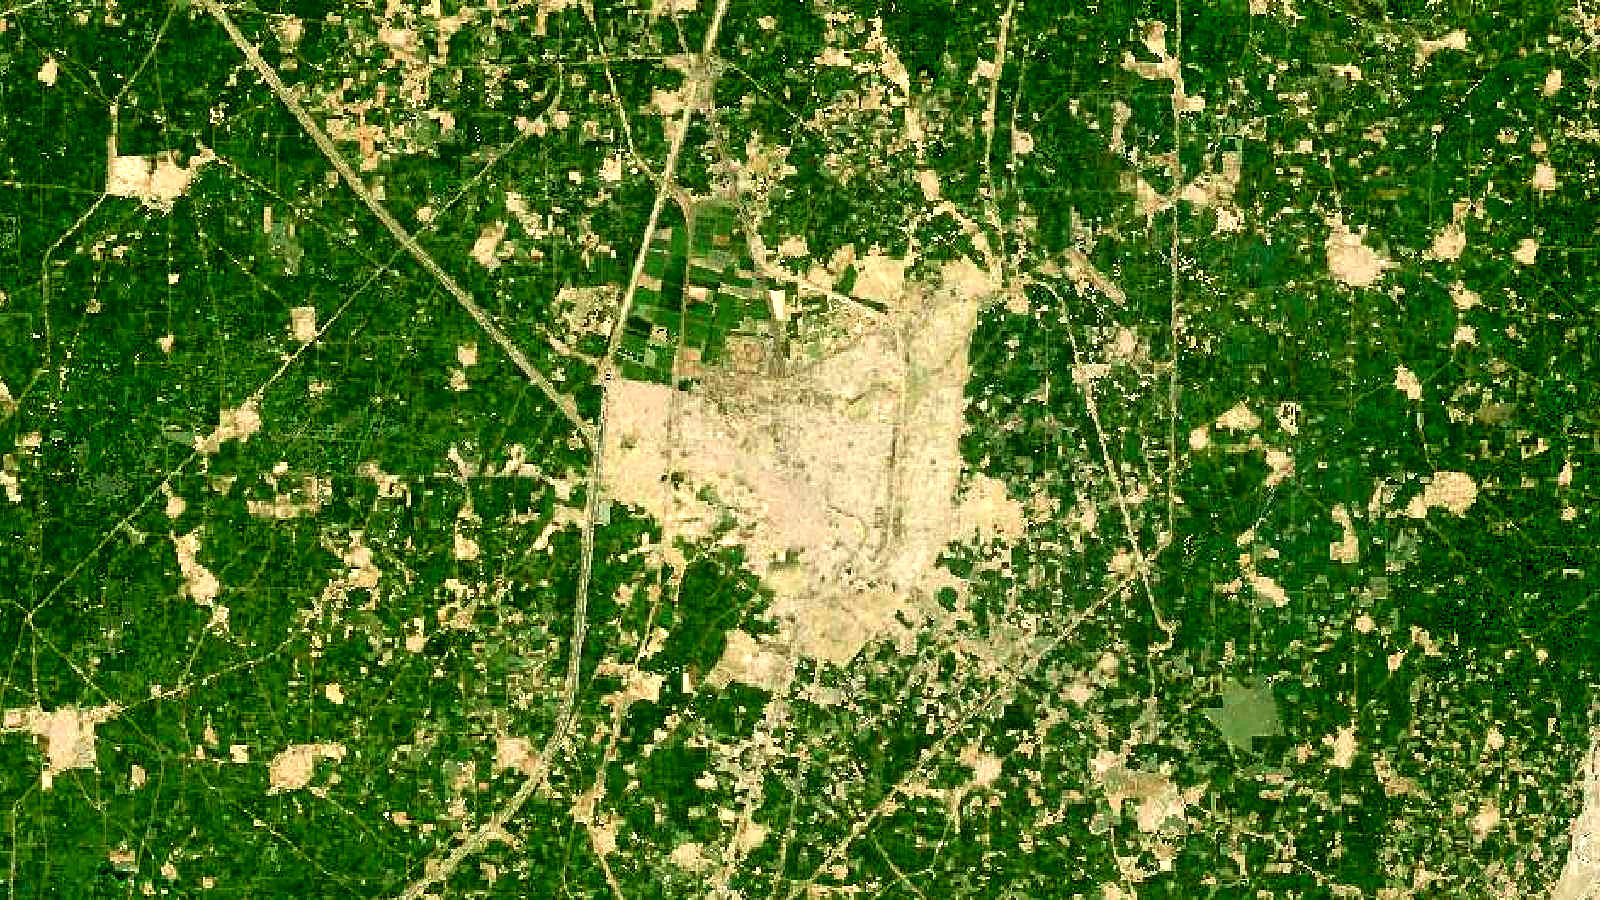
Cover image: Landsat true-colour composite of irrigated farmland near Karnal, Haryana (2000), NASA/USGS Landsat WELD via NASA GIBS (public domain).