DEM Vertical Accuracy: SRTM vs ALOS vs Copernicus Compared
A technical comparison of SRTM, ALOS AW3D30, and Copernicus DEM vertical accuracy across India's diverse terrain, with a decision framework for watershed delineation, flood mapping, and landslide modelling.
Why This Comparison Matters Right Now
For years, most of us in Indian GIS workflows defaulted to SRTM. It was free, globally consistent, and good enough for regional-scale work. Then ALOS World 3D (AW3D30) arrived and quietly raised the bar, particularly in forested and hilly terrain. Now Copernicus DEM, derived from the TanDEM-X mission and released freely at both 30 m and 90 m resolutions, has entered the picture with specifications that, on paper, outperform both predecessors.
The practical question isn't which DEM is technically superior in a vacuum. It's which one you should reach for when you're delineating watersheds in the Western Ghats, mapping flood extents in the Ganga plains, or running landslide susceptibility models in Uttarakhand. Those use cases have different tolerances for vertical error, and India's terrain diversity, from the flat Indo-Gangetic Plain to the rugged Himalayas, means no single answer fits every project.
This article walks through what we know about the vertical accuracy of each dataset, how their production methods shape their error characteristics, and a worked decision framework for common Indian applications.
How Each DEM Was Built, and Why That Shapes Accuracy
Understanding production methodology is the fastest way to anticipate where a DEM will fail you.
SRTM (Shuttle Radar Topography Mission) was acquired in February 2000 using C-band radar interferometry during a single 11-day Space Shuttle mission. The C-band signal (roughly 5.6 cm wavelength) penetrates vegetation canopy partially, meaning the elevation it records in forested areas is somewhere between the ground and the top of the canopy, not a clean bare-earth surface. Void-filled versions (NASA SRTM v3, also distributed via USGS EarthExplorer) have improved coverage, but the underlying interferometric noise in steep terrain remains. The nominal absolute vertical accuracy target for SRTM was 16 m at 90% confidence globally, though independent validation studies have consistently shown performance better than that over most terrain types.
ALOS AW3D30 is derived from the PRISM optical stereo sensor aboard JAXA's ALOS satellite, with data acquired between 2006 and 2011. Because it uses optical stereo photogrammetry rather than radar, it is a surface model that reflects the top of whatever the sensor sees, buildings, trees, bare rock. In open terrain this closely approximates a DTM; in dense forest it does not. JAXA reports an absolute vertical accuracy of around 5 m RMSE for the global product, which independent studies have broadly confirmed in open and semi-open landscapes. One practical advantage: the ALOS archive is multi-temporal, so some regional reprocessing efforts have improved accuracy over specific geographies.
Copernicus DEM is generated from TanDEM-X, a German Aerospace Center (DLR) mission using X-band radar interferometry (roughly 3.1 cm wavelength). X-band has shallower canopy penetration than C-band, so in forested areas it tends to sit closer to the canopy top, which is both a limitation and a consistency advantage depending on your application. The key differentiator is data quality: TanDEM-X acquired multiple passes over most of the globe, allowing DLR to select the best interferometric coherence for each area and to fill voids with secondary acquisitions rather than interpolation. The Copernicus DEM GLO-30 (30 m) and GLO-90 (90 m) are now freely available through the Copernicus Land Service and AWS Open Data. ESA and DLR report absolute vertical accuracy better than 4 m at 90% confidence for the global product, with considerably better performance over flat and gently rolling terrain.
How Do They Compare Numerically Over Indian Terrain?
Because the research brief for this article does not include specific peer-reviewed validation studies over Indian terrain that I can cite with confidence, I'll frame this comparatively rather than with invented numbers, but the directional picture is well-established in the literature.
Flat alluvial terrain (Indo-Gangetic Plain, deltas): All three DEMs perform relatively well here. Vertical errors are lowest, and the choice matters less for gross elevation accuracy. Copernicus DEM tends to show slightly lower RMSE than SRTM in independent global assessments; AW3D30 is competitive. For flood modelling in the Ganga-Brahmaputra basin, the difference between DEMs may matter less than your hydrological conditioning method.
Hilly and plateau terrain (Deccan, Eastern Ghats, Chhattisgarh): This is where SRTM's C-band noise and void-filling artifacts become more visible. AW3D30 and Copernicus DEM both show improvement. Aspect and slope derivatives are noticeably cleaner in Copernicus DEM over dissected plateau edges.
Dense forest (Western Ghats, Northeast India): All three are surface models to varying degrees, but the differences in canopy penetration between C-band (SRTM), optical stereo (AW3D30), and X-band (Copernicus) mean you're comparing three different "surfaces." For bare-earth hydrology in these areas, none is a true DTM without additional processing. If you need a DTM, you're looking at airborne LiDAR or ICESat-2 fusion, not a choice between these three.
High-relief Himalayan terrain: This is the hardest test. Steep slopes, radar layover and shadow, snow and ice surfaces, and rapid change all degrade accuracy. SRTM has well-documented issues with voids and layover artifacts in the Himalayas. Copernicus DEM's multi-pass acquisition strategy reduces (but does not eliminate) these artifacts. For hazard work in Uttarakhand or Himachal Pradesh, Copernicus DEM is currently the strongest freely available global option, but you should always validate against ICESat-2 ATL08 or ground control before drawing conclusions about slope angles.
A Worked Decision Framework for Common Indian Applications
Here's a practical routing guide based on application type:
- Regional watershed delineation (1:50,000 scale or smaller), flat to moderate terrain: SRTM or Copernicus DEM GLO-90 are both adequate. Copernicus is preferred if available, for its lower noise floor.
- Detailed drainage network extraction, hilly terrain: Copernicus DEM GLO-30. Apply a sink-fill and stream-burning workflow regardless of which DEM you use.
- Landslide susceptibility mapping, Himalayan or Western Ghat foothill zones: Copernicus DEM GLO-30 as your primary; validate slope and aspect derivatives against ICESat-2 point elevations where possible.
- Urban flood modelling: None of these is ideal without building-mask removal. AW3D30 or Copernicus DEM, then subtract a building footprint layer if you have one.
- Contour generation for topographic mapping: Copernicus DEM GLO-30 is currently the best freely available global option. For cadastral or engineering scales, you need local survey data or LiDAR.
- Change detection (pre/post event DEM differencing): Do not mix DEMs across epochs. Use the same source, or explicitly account for inter-DEM biases.
Accessing These DEMs for India
All three are freely available:
- SRTM: USGS EarthExplorer or NASA Earthdata
- ALOS AW3D30: JAXA ALOS Research and Application Project
- Copernicus DEM GLO-30 / GLO-90: Copernicus Land Monitoring Service or directly via AWS Open Data
For most new projects in India starting today, I'd recommend beginning with Copernicus DEM GLO-30 and only reverting to SRTM if you have a legacy workflow dependency or need pre-2000 consistency for change analysis.
The Accuracy You Can't See: Systematic Biases
One underappreciated issue in DEM vertical accuracy comparison is systematic bias versus random error. A DEM can have low RMSE globally but carry a consistent elevation offset over a specific land cover type or terrain class. SRTM is known to have a positive bias over dense vegetation (it reads high because the radar partially reflects off canopy). Copernicus DEM, with its X-band radar, has a similar but generally smaller bias in forested areas.
Before running any quantitative analysis, slope, volume, flood depth, it is worth extracting your DEM values at ICESat-2 ATL06 (land ice) or ATL08 (terrain and canopy) ground tracks over your study area and checking for systematic offsets. This takes an afternoon in QGIS or Python and can save you from publishing results built on a 3–5 m vertical shift you never noticed.
Frequently asked questions
What is Copernicus DEM's reported vertical accuracy?
ESA and DLR report Copernicus DEM's absolute vertical accuracy as better than 4 metres at 90% confidence for the global product, with notably better performance over flat and gently rolling terrain.
What was SRTM's original target vertical accuracy?
SRTM's nominal absolute vertical accuracy target was 16 metres at 90% confidence globally, though independent validation studies have consistently shown it performing better than that target across most terrain types.
Which DEM is recommended for landslide susceptibility mapping in the Himalayas?
Copernicus DEM GLO-30 is recommended as the primary dataset for Himalayan or Western Ghat foothill landslide susceptibility mapping, with slope and aspect derivatives validated against ICESat-2 point elevations where possible.
Why does SRTM show a positive elevation bias over forests?
SRTM is known to have a positive elevation bias over dense vegetation because its C-band radar partially reflects off the forest canopy rather than the true ground surface, causing it to read higher than actual terrain height.
References
- USGS EarthExplorer (SRTM data access): https://earthexplorer.usgs.gov/
- JAXA ALOS AW3D30 product page: https://www.eorc.jaxa.jp/ALOS/en/aw3d30/
- Copernicus Land Monitoring Service - DEM product: https://land.copernicus.eu/en/products/digital-elevation-model
- Copernicus DEM on AWS Open Data Registry: https://registry.opendata.aws/copernicus-dem/
- NASA ICESat-2 Mission (ATL06/ATL08 for validation): https://icesat-2.gsfc.nasa.gov/
Researched and drafted with AI assistance.
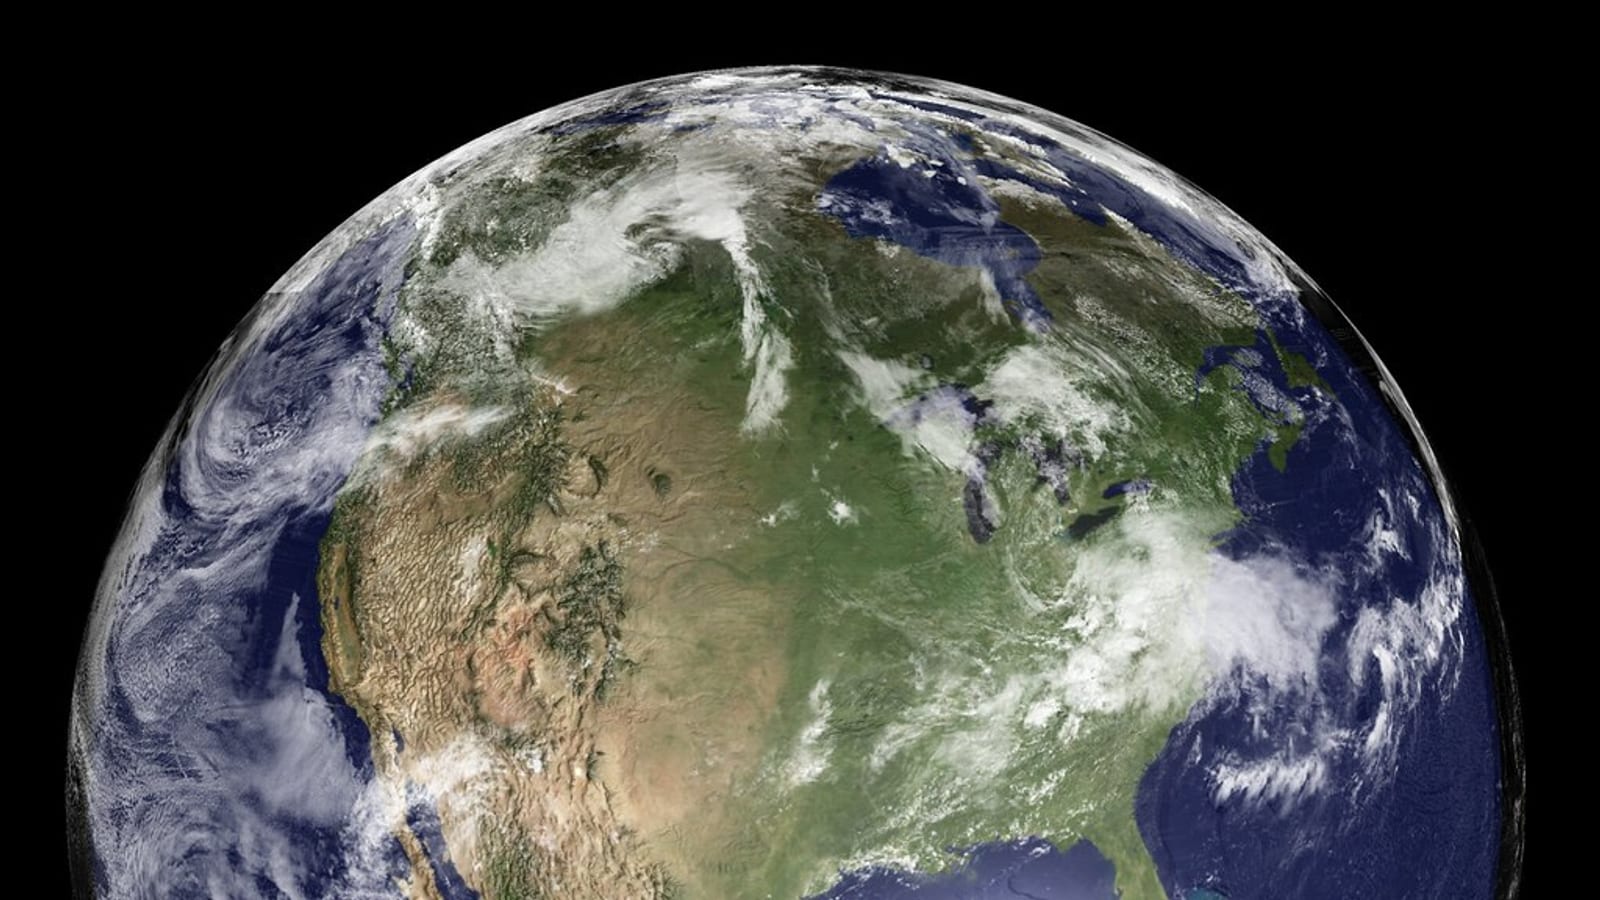
Hero image: "Earth - Global Elevation Model with Satellite Imagery" by Kevin M. Gill is licensed under CC BY 2.0. To view a copy of this license, visit https://creativecommons.org/licenses/by/2.0/.