Drone Surveys for Waste Quantification: Methods and Accuracy
A technical walkthrough of drone photogrammetry workflows for legacy waste quantification in India, using the Bandhwari landfill survey as a case study, covering GCPs, GSD, and realistic volume accuracy.
Why Bandhwari Matters Beyond Gurgaon
The Gurugram District Collector's order for a fresh drone survey of the Bandhwari landfill, reported by both The Times of India and Hindustan Times, is not just a local administrative story. It signals something broader: Indian municipalities are increasingly turning to photogrammetric drone surveys as the baseline tool for legacy waste quantification, rather than relying on ground-level estimates or older topographic maps. If you work in GIS, remote sensing, or solid-waste management in India, understanding exactly how this method works, and where it can mislead you, is now a practical necessity.
This article walks through the full workflow, the accuracy you can realistically expect, and the decisions that determine whether your volume estimate is defensible or not.
What Is Drone-Based Photogrammetric Volume Estimation?
At its core, the method is straightforward: fly a drone over a waste mound, capture overlapping images, reconstruct a 3D surface model, and subtract a reference surface (what the ground looked like before waste was deposited) to get volume.
The key outputs are:
- Dense point cloud, millions of 3D points derived from image matching
- Digital Surface Model (DSM), a raster representing the top surface of the waste pile
- Digital Terrain Model (DTM), the underlying ground surface, used as the reference plane
- Volume, calculated as the integral of the height difference between DSM and DTM over the area of interest
The IJERT study on waste volume estimation using drone-based photogrammetry demonstrates this pipeline explicitly, combining drone imagery with GIS software, DGPS (Differential GPS), and Ground Control Points (GCPs) to compute solid waste volumes. The same study found that accuracy improved to within 2× the Ground Sampling Distance (GSD) of the imagery, a metric I'll unpack below.
The Role of Ground Control Points and DGPS
This is the step that most non-specialists underestimate. A drone camera alone gives you relative geometry; GCPs surveyed with DGPS give you absolute, georeferenced geometry. Without well-distributed GCPs, your volume estimate can carry horizontal and vertical errors large enough to make the number meaningless for planning purposes.
Practical guidance from the IJERT research and general photogrammetric practice:
- Minimum GCPs: At least 5–6 for a small to medium landfill; more for irregular or large sites
- Distribution: Place GCPs at the perimeter and, where accessible, across the waste surface, not clustered in one corner
- DGPS accuracy: Sub-centimetre to centimetre-level vertical accuracy is achievable with RTK/PPK-enabled receivers
- Check points: Keep 2–3 GCPs as independent check points (not used in the model), so you have an honest error estimate
For a legacy landfill like Bandhwari, where the surface is uneven and access is restricted, GCP placement becomes logistically challenging. This is precisely where careful mission planning pays off.
How Accurate Is the Volume Estimate, Really?
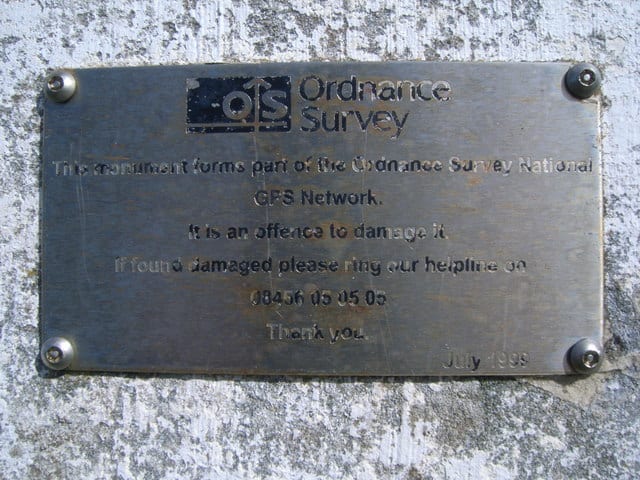
Illustrative: DGPS ground control point placement. "Ordnance Survey plaque - geograph.org.uk - 960878" by Nicholas Mutton is licensed under CC BY-SA 2.0. To view a copy of this license, visit https://creativecommons.org/licenses/by-sa/2.0/.
The short answer: it depends on GSD, GCP quality, and the complexity of the surface.
GSD is the ground dimension represented by one pixel. At a typical survey altitude of 80–100 m with a consumer-grade drone camera, GSD is roughly 2–4 cm. The IJERT study's finding, accuracy within 2× GSD, means vertical errors on the order of 4–8 cm under good conditions. For a large landfill covering several hectares, even a 5 cm vertical error integrated over the whole area can translate to a non-trivial volume uncertainty.
A worked example to make this concrete:
Suppose the Bandhwari survey covers a 10-hectare waste footprint (100,000 m²). A uniform vertical error of just 5 cm across that area equals 5,000 m³ of volume uncertainty, roughly equivalent to several hundred truckloads of waste. This is why the survey methodology, not just the drone flight, determines whether the output is fit for policy decisions.
The ScienceDirect paper on detecting volume changes in MSW landfills reinforces this point: laser scanning (LiDAR) from aircraft and drones is also being applied to landfill volume change detection, and the choice between photogrammetry and LiDAR often comes down to budget, required accuracy, and surface texture. Photogrammetry struggles on surfaces with little visual texture or under dense vegetation; LiDAR does not.
Photogrammetry vs. LiDAR for Landfill Surveys
Both methods produce point clouds and surface models, but they differ in important ways for waste applications:
| Factor | Photogrammetry | LiDAR |
|---|---|---|
| Cost | Lower (standard drone + camera) | Higher (dedicated LiDAR sensor) |
| Texture dependence | High, struggles on uniform surfaces | Low, works on any surface |
| Penetration through debris | None | Partial (sparse vegetation) |
| Accuracy (vertical) | ~2–5 cm with good GCPs | ~1–3 cm |
| Processing complexity | Moderate | Moderate to high |
For a mixed-waste legacy landfill with varied surface materials, photogrammetry is generally adequate for volumetric estimates at the planning level. LiDAR becomes more attractive when you need repeated monitoring over time or when the surface has low visual contrast.
Firms like Matrix Geo Solutions, which have evolved through India's drone mapping and LiDAR adoption curve, are well-positioned to offer both modalities, an important consideration as Indian municipalities scale up waste monitoring.
The Reference Surface Problem
One issue that rarely gets discussed in news coverage: where does your DTM (pre-waste ground surface) come from?
For a landfill that has been accumulating waste for decades, no one flew a drone over it before the waste arrived. You are left with options that each carry uncertainty:
- Historical topographic maps, coarse resolution, often outdated
- Extrapolation from surrounding undisturbed terrain, introduces assumptions about original ground slope
- Partial ground-truthing, drilling or probing at selected points to locate the original ground surface
The UAV photogrammetry study on laboratory and field sites highlights how point cloud quality at the base of a pile directly affects volume accuracy. For legacy landfills, the reference surface uncertainty can easily exceed the photogrammetric measurement error itself. Any honest survey report should quantify both.
What the Bandhwari Survey Should Deliver
Based on the reported objectives, verifying legacy waste quantity and status, boosting processing capacity, and planning a separate site for fresh waste, the drone survey output should include at minimum:
- A georeferenced DSM at ≤5 cm GSD
- A documented reference DTM with stated assumptions
- Volume estimate with explicit uncertainty bounds (not just a single number)
- Spatial breakdown of waste density zones, if multispectral or thermal data is collected alongside RGB
- Change detection capability: the current DSM should be archived so future surveys can compute net removal progress
The last point is operationally important. A single volume estimate tells you how much waste is there today. Repeated surveys at 3–6 month intervals tell you whether the clean-up is actually working, which is ultimately what the DC's order is trying to achieve.
Practical Takeaways for GIS Practitioners
If you are involved in designing or reviewing a similar survey in India:
- Insist on a GCP report: number of points, DGPS method used, residual errors at check points
- Ask for the reference DTM source and its uncertainty: this is often the weakest link
- Request volume with uncertainty, not just a point estimate: a range is more honest and more useful
- Plan for repeat surveys from the start: consistent flight parameters and GCP locations enable change detection
- Check regulatory compliance: drone operations over waste sites may require permissions under DGCA's updated drone rules; coordinate early
Drone survey waste quantification is a mature enough technique that the methodology should no longer be a black box in project reports. Demanding transparency on these parameters is not pedantry, it is what separates a defensible estimate from a number that looks precise but isn't.
Frequently asked questions
How accurate are drone-based volume estimates for landfill waste?
Accuracy depends on GSD, GCP quality, and surface complexity. One study found errors within 2x the GSD; at a typical 2-4 cm GSD (roughly 80-100 m flight altitude), that translates to about 4-8 cm vertical error under good conditions.
How many ground control points are needed for a landfill drone survey?
A landfill survey needs at least 5-6 well-distributed GCPs for a small to medium site, more for irregular or large sites, with 2-3 additional points kept as independent checks for an honest error estimate.
Is photogrammetry or LiDAR better for landfill volume surveys?
Photogrammetry is cheaper and generally adequate for planning-level volumetric estimates on mixed-waste sites, while LiDAR is pricier but preferred for repeated monitoring or surfaces with low visual contrast where photogrammetry struggles.
Why is the reference ground surface a problem for legacy landfill volume estimates?
Decades-old landfills have no pre-waste drone data, so the reference ground surface relies on historical maps, extrapolation from surrounding terrain, or partial ground-truthing, and this uncertainty can exceed the photogrammetric measurement error itself.
References
- Drone survey to check quantity and status of Bandhwari legacy waste - Times of India
- Gurugram DC orders faster clean-up of Bandhwari legacy waste, new drone survey - Hindustan Times
- Waste Volume Estimation using Drone based Photogrammetry, IJERT
- Detecting volume changes in municipal solid waste landfill using laser scanning - ScienceDirect
- UAV photogrammetry point cloud model - ResearchGate
- How Matrix Geo Solutions navigated India's geospatial evolution - YourStory
- Surface Change and Stability Analysis in Open-Pit Mines Using UAV - MDPI Drones
Researched and drafted with AI assistance.
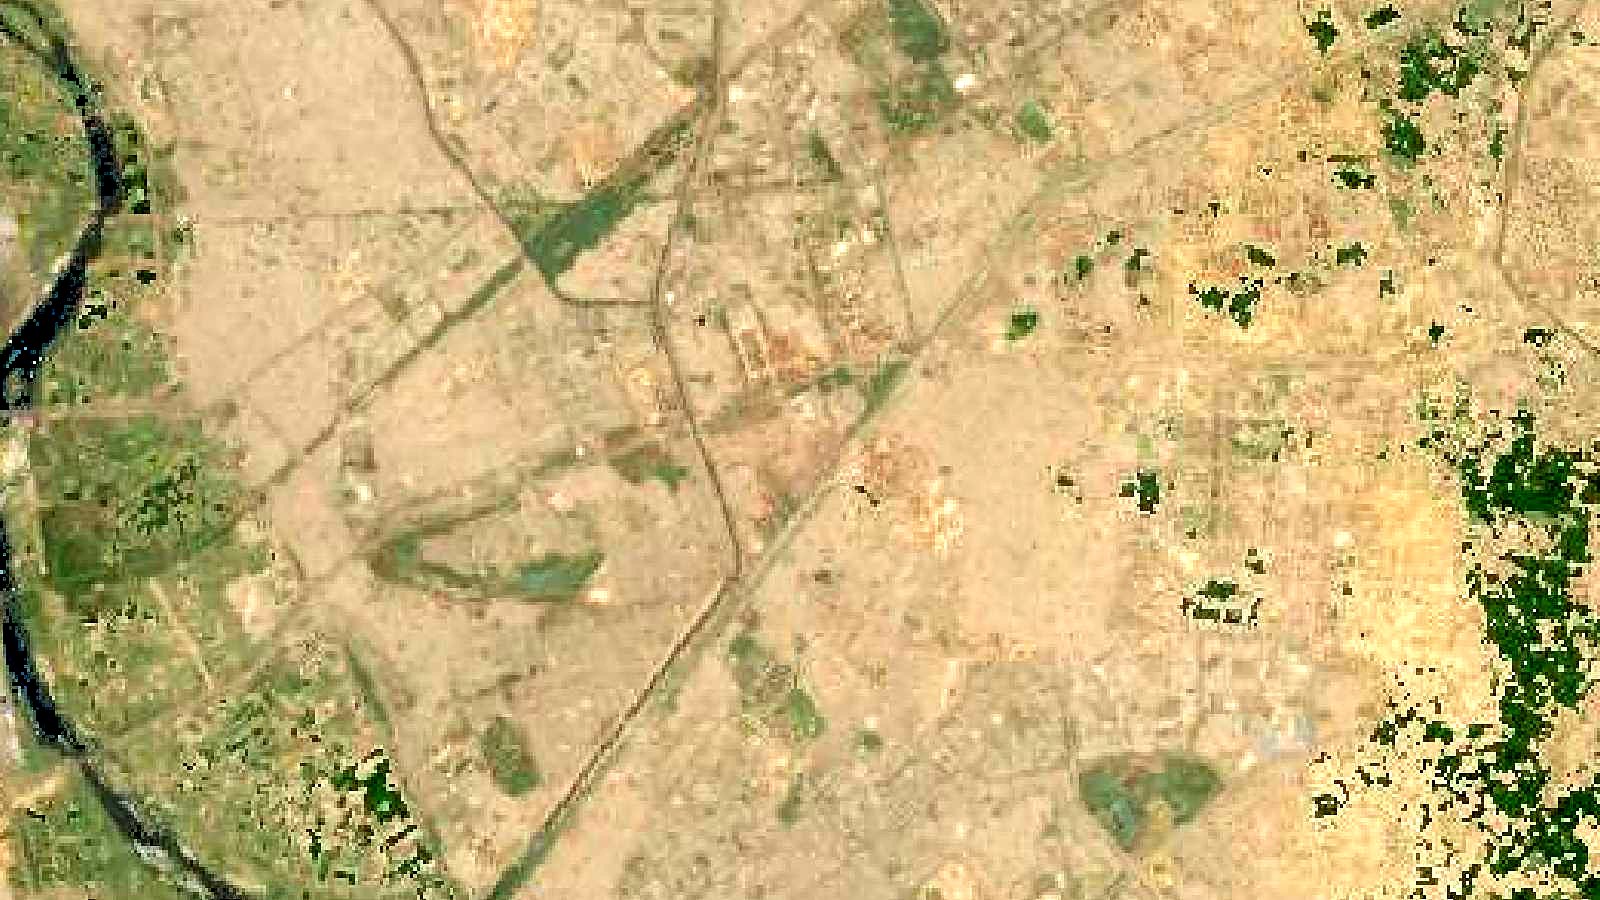
Cover image: Landsat true-colour composite of east Delhi around the Ghazipur landfill (2000), NASA/USGS Landsat WELD via NASA GIBS (public domain).