Flood Depth Estimation from Sentinel-1 SAR: Methods and Limits
Flood extent mapping from Sentinel-1 SAR is now routine, but translating backscatter into actual water depths is far harder. This article breaks down the main methods, hydraulic model fusion, DEM differencing, and their real limits, for Indian flood contexts.
Why Depth Matters More Than Extent Right Now
Flood extent mapping from Sentinel-1 SAR has become almost routine. Change-detection workflows, thresholding on backscatter values, and open tools like the Copernicus Emergency Management Service (CEMS) have made it possible to produce reasonably reliable inundation maps within hours of a satellite pass. During the Kerala floods, the Assam floods, and the repeated inundation cycles across the Brahmaputra and Ganga floodplains, extent maps were among the first products disseminated to responders.
But extent is a binary answer to a continuous problem. Knowing that a village is under water does not tell a district collector whether the water is ankle-deep or roof-deep, whether a particular road is passable for relief trucks, or how many people are trapped above the first floor. Flood depth estimation from SAR, translating backscatter signals into actual water column heights, is the next frontier, and it remains genuinely hard. Before you hand a depth map to a decision-maker, you need to understand what the method can and cannot do.
How SAR Backscatter Encodes (and Obscures) Depth Information
Sentinel-1 operates in C-band (roughly 5.6 cm wavelength) and measures the intensity of microwave energy scattered back from the surface. Open water produces very low backscatter because a calm surface acts like a specular reflector, energy bounces away from the sensor. Flooded vegetation and urban areas produce anomalously high backscatter through double-bounce scattering between the water surface and vertical structures.
The problem is that backscatter intensity is sensitive to many variables simultaneously:
- Surface roughness, wind-roughened water returns more backscatter than calm water, mimicking land
- Vegetation structure, a flooded paddy field at tillering stage behaves very differently from one at heading stage
- Soil moisture, wet but unflooded soil can have backscatter values that overlap with shallow inundation
- Incidence angle - Sentinel-1 IW mode covers roughly 29°–46°, and the same water depth will return different values at different angles
- Urban clutter, double-bounce from buildings can saturate the signal regardless of depth
None of these factors encodes depth directly. Backscatter tells you something about the surface condition, not the vertical extent of the water column below it. This is the fundamental limitation that every depth-estimation method has to work around.
The Main Approaches to Flood Depth Estimation from SAR
1. Hydraulic Model Fusion
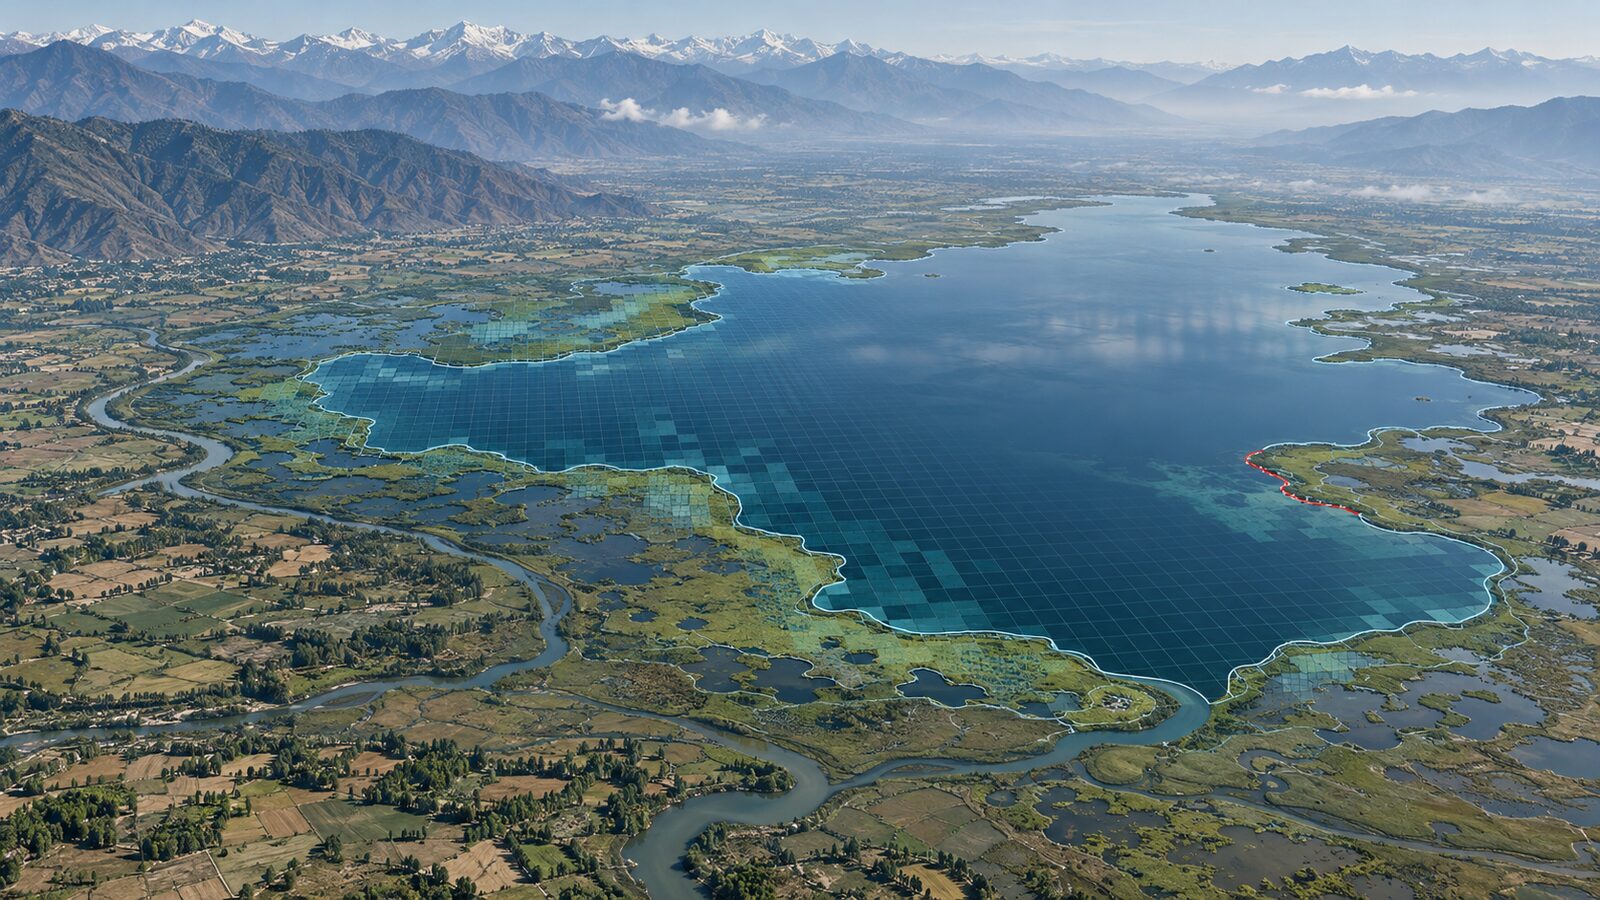
The most operationally mature approach is to use the SAR-derived flood extent as a boundary condition or validation layer for a hydraulic model (HEC-RAS, LISFLOOD-FP, or similar). The model, driven by upstream gauge data or rainfall-runoff outputs, simulates water surface elevation across the floodplain. Where the simulated extent matches the SAR extent reasonably well, the model's depth grid is considered valid.
This is not purely a remote-sensing method, it relies heavily on the quality of the terrain model (a high-resolution DEM is essential), the accuracy of river bathymetry, and the availability of real-time discharge data. In India, the Central Water Commission (CWC) maintains gauge networks, but coverage is uneven in headwater regions and data sharing with modellers is not always seamless.
2. SAR + DEM Differencing (Planar Water Surface Assumption)
A simpler approach assumes that the flood water surface is approximately planar (or follows a gentle slope) within a local reach. If you know the water surface elevation at one or more points, from gauges, from ICESat-2 altimetry, or from the intersection of the flood boundary with a DEM contour, you can subtract the bare-earth DEM elevation from the assumed water surface elevation at every inundated pixel to get depth.
Worked example (conceptual): Suppose a SAR image shows inundation across a 10 km reach of a river. The flood boundary intersects a known contour at 52 m elevation on both banks. Assuming a flat water surface at 52 m across that reach, and using a 1-metre resolution DEM, depth at any pixel = 52 m − (DEM elevation at that pixel). A pixel with DEM elevation 49.5 m gets assigned a depth of 2.5 m.
The method is fast and transparent, but the planar assumption breaks down over long reaches with significant slope, in backwater zones, and wherever the DEM has errors, which in India often means areas with dense vegetation canopy (where photogrammetric DEMs are unreliable) or older Survey of India topographic data digitised at coarse contour intervals.
3. Multi-Temporal SAR Analysis
Some researchers use the rate of change in backscatter across multiple Sentinel-1 passes (which has a 6-day repeat at the equator, sometimes 12 days for a single orbit direction over India) to infer recession dynamics and, indirectly, depth gradients. Pixels that de-flood quickly are likely shallower; persistent inundation suggests greater depth or slower drainage. This is more of a relative depth indicator than an absolute one, and it requires multiple cloud-free (SAR is cloud-independent, but the DEM inputs are not always current) acquisitions during the flood event.
4. Polarimetric Decomposition
Sentinel-1 in IW mode provides dual polarisation (VV and VH). The ratio VH/VV and decomposition of the polarimetric signal can help separate open water, flooded vegetation, and urban double-bounce classes more cleanly than single-channel thresholding. While this improves extent accuracy, particularly under vegetation, it does not directly yield depth. It is a useful pre-processing step before applying any of the methods above.
Where Indian Conditions Make This Harder
India's flood-prone landscapes present specific challenges that generic method papers often understate:
Dense floodplain agriculture. The Ganga-Brahmaputra plains are intensively cultivated. During kharif season, standing crops partially attenuate the SAR signal, causing underestimation of inundated area and making depth inference from backscatter even less reliable.
DEM quality. SRTM (30 m) remains widely used, but its vertical accuracy in vegetated, low-relief floodplains is often insufficient for depth estimation at the sub-metre level that would actually be useful for evacuation decisions. TanDEM-X offers better vertical accuracy but is not freely available. The upcoming NISAR mission (a joint NASA-ISRO L- and S-band SAR satellite) may improve things, but operational DEM products from it are still in the future.
Gauge data gaps. Depth estimation via hydraulic fusion depends on good boundary conditions. In the northeastern states and in Himalayan tributaries, gauge density is low and real-time telemetry is patchy.
Urban flooding. Cities like Chennai, Mumbai, and Patna experience pluvial and fluvial flooding simultaneously. Urban SAR signatures are dominated by building geometry, making both extent mapping and depth estimation substantially harder than in open agricultural plains.
What Practitioners Should Actually Do
If you are producing or consuming flood depth products from SAR, here is a realistic checklist:
- State your assumptions explicitly, which DEM, which water surface model, what validation data.
- Report uncertainty bounds, not just a single depth value. A depth map without uncertainty is overconfident.
- Cross-check with gauge observations wherever they exist. Even a handful of validation points dramatically improves credibility.
- Distinguish open-water depth from under-canopy depth - SAR cannot see under dense vegetation; your depth map has a systematic gap there.
- Do not use depth estimates for life-safety decisions without hydraulic model corroboration. SAR-derived depth alone is not yet reliable enough for that.
- Document the Sentinel-1 acquisition parameters, orbit direction (ascending/descending), polarisation, incidence angle range, because these affect what the backscatter means.
The honest position is that flood depth estimation from SAR is a research-active area, not a solved operational problem. Extent mapping earns a B+; depth estimation is still working toward a passing grade in complex real-world conditions.
Frequently asked questions
Can Sentinel-1 SAR directly measure flood depth?
No. Sentinel-1 backscatter reflects surface condition, not water column height, because it is affected by roughness, vegetation, soil moisture and incidence angle rather than depth itself. Depth must be inferred indirectly through methods like hydraulic modelling or DEM differencing.
What is the simplest method to estimate flood depth from SAR and a DEM?
Assume the flood water surface is roughly flat, find the elevation where the flood boundary meets a known contour, then subtract the DEM elevation at each inundated pixel from that surface elevation to get depth.
Why is SRTM's 30 m DEM not accurate enough for flood depth mapping in India?
SRTM's vertical accuracy in vegetated, low-relief floodplains is often too coarse for the sub-metre precision needed for evacuation decisions; TanDEM-X is more accurate but not freely available.
Should flood depth maps from SAR be used for evacuation decisions on their own?
No. SAR-derived depth estimates alone are not yet reliable enough for life-safety decisions and should always be corroborated with a hydraulic model before being used for evacuation planning.
References
No specific numbered studies were cited in the research brief for this article. The methods and limitations described reflect the general state of the field as understood from open literature on Sentinel-1 SAR flood mapping, hydraulic model fusion, and DEM-based depth estimation. Readers are encouraged to consult:
- Copernicus Emergency Management Service (CEMS): https://emergency.copernicus.eu
- Central Water Commission, India (flood forecasting): https://cwc.gov.in
- NASA-ISRO NISAR mission overview: https://nisar.jpl.nasa.gov
- ESA Sentinel-1 mission documentation: https://sentinel.esa.int/web/sentinel/missions/sentinel-1
Researched and drafted with AI assistance.
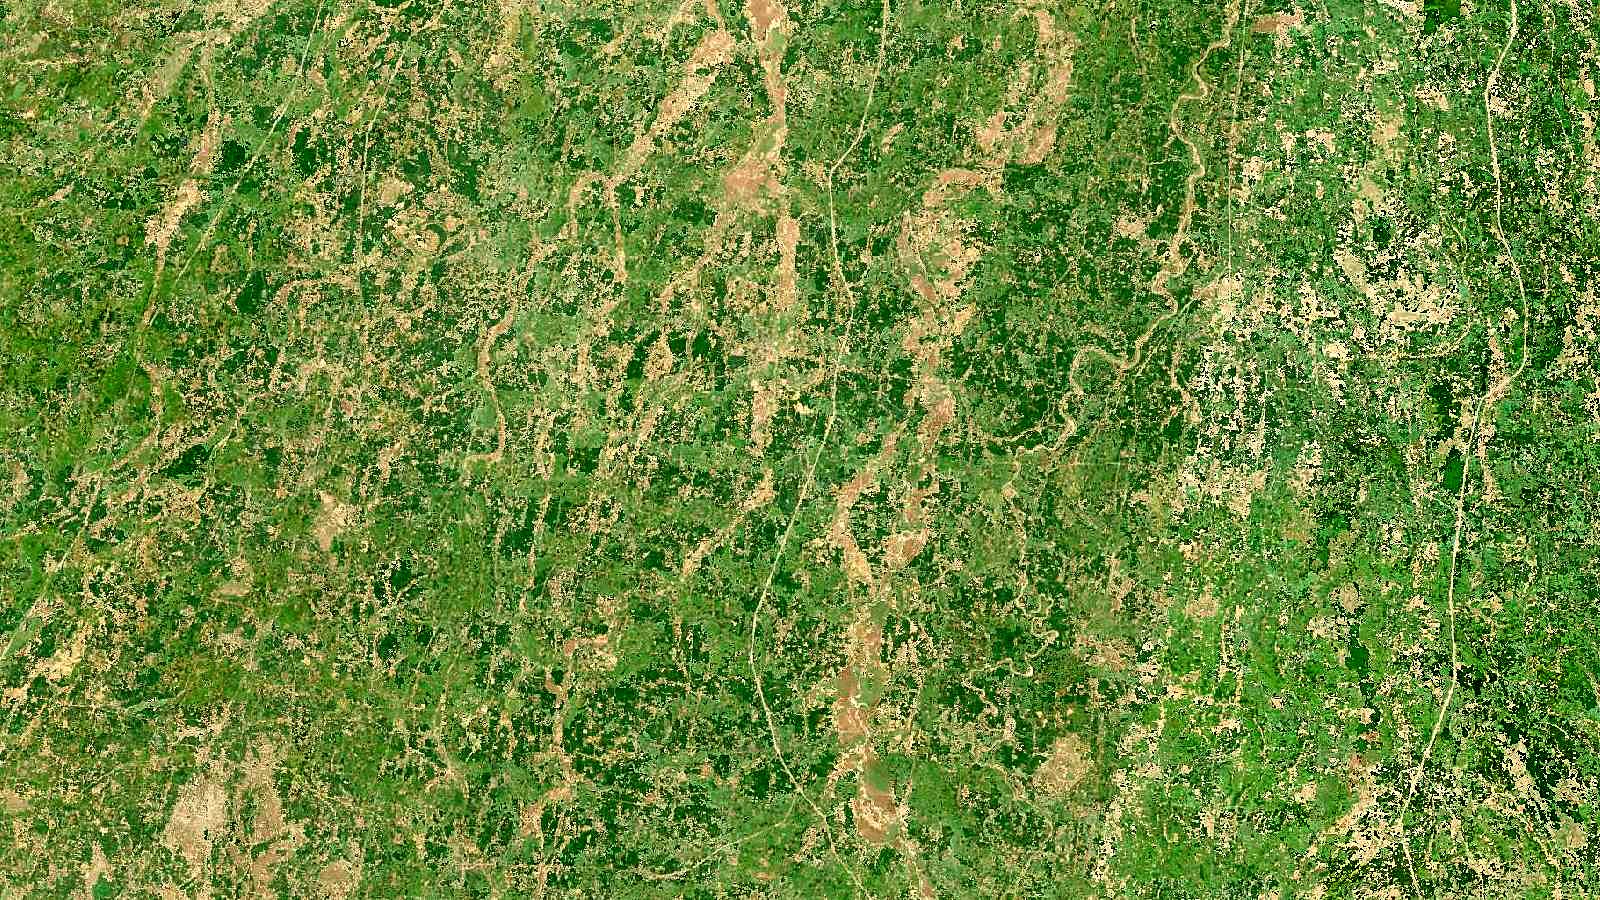
Cover image: Landsat true-colour composite of the Kosi river in north Bihar (2000), NASA/USGS Landsat WELD via NASA GIBS (public domain).