Mapping Soil Salinity in GEE: Indices, Datasets and Code
A practical guide to mapping soil salinity in Google Earth Engine using validated spectral indices, Sentinel-2 and Landsat datasets, and code patterns tuned for India's Indo-Gangetic Plain and coastal deltas.
Why This Moment Matters for Indian Soil Scientists
Five days ago, the Food and Agriculture Organization released fresh guidance on digital soil salinity monitoring, covering tools, algorithms, and practical applications for building operational monitoring systems. That timing is significant. Salt-affected soils already represent a major constraint to agricultural productivity across India's Indo-Gangetic Plain and coastal deltas, and the gap between knowing that and being able to measure it routinely is exactly what Google Earth Engine (GEE) can close.
This article walks through the indices, datasets, and GEE code patterns you actually need, not a conceptual overview, but something you can adapt and run.
Why Remote Sensing Indices Work for Salinity Detection
Soil salinity alters surface reflectance in predictable ways. High salt concentrations change soil moisture retention, crust the surface with white efflorescence, and stress vegetation, all of which leave spectral fingerprints across visible, near-infrared (NIR), and shortwave infrared (SWIR) bands.
Research on the Indo-Gangetic Plain has demonstrated that a combination of salinity-specific and vegetation indices improves prediction accuracy over any single index. A temporal remote sensing study on the Indo-Gangetic Plain found that indices including RNDSI, NDSI, and NDWI performed well when combined with machine-learning techniques. A parallel study using Sentinel-2 in the Mekong Delta reinforced that AI-assisted classification with spectral indices can map salinity distribution at the delta scale with usable accuracy.
The most commonly validated indices for salinity work are:
- SI (Salinity Index):
sqrt(Red × Green), sensitive to bare salt crusts - SI-1:
sqrt(Blue × Red), variant for bright salt surfaces - NDSI (Normalised Difference Salinity Index):
(Red − NIR) / (Red + NIR), contrasts soil brightness against vegetation signal - RNDSI:
(SWIR1 − Green) / (SWIR1 + Green), particularly effective for subsurface salinity proxies - NDVI: standard vegetation health proxy; low NDVI in cropped areas often co-locates with salinity stress
- EVI and SAVI: useful in areas with mixed bare-soil and sparse vegetation cover, common in Rajasthan and Punjab margins
A global salinity estimation effort at 10 m resolution presented at the FAO's Global Soil Information Day used indices from Sentinel-2 alongside multi-source inputs to map saline soils across roughly 1.1 billion hectares globally, demonstrating that 10 m mapping is now operationally feasible, not just academic.
Which Datasets to Load in GEE
For India, a practical stack looks like this:
Sentinel-2 Surface Reflectance (COPERNICUS/S2_SR_HARMONIZED) The 10 m and 20 m bands give you the spectral resolution needed for NDSI, RNDSI, and SWIR-based indices. Filter to Rabi season (November–February) for the Indo-Gangetic Plain, this is when bare salt-affected fields are most exposed and spectrally distinct. The Sentinel-2 index database is a useful reference for band mappings before you write expressions in GEE.
Landsat 8/9 SR (LANDSAT/LC08/C02/T1_L2 or LC09) Lower spatial resolution (30 m) but a longer archive, critical if you want multi-year trend analysis going back to 2013. Useful for tracking salinity expansion or recession in response to irrigation changes.
SRTM DEM (USGS/SRTMGL1_003) Topographic position matters. Low-lying areas in delta systems and waterlogged depressions in Punjab accumulate salts through capillary rise. Including elevation and slope as covariates improves model accuracy.
iSDA Soil Data or SoilGrids (via GEE community datasets) Soil texture (clay content, bulk density) has been shown to influence salinity predictions. A study examining ECe against remote sensing indices and soil texture found that integrating texture properties alongside spectral indices strengthened salinity estimation models.
A Worked GEE Example: Computing NDSI and RNDSI for Punjab
Here is a minimal, annotated GEE JavaScript snippet for computing two salinity indices over Punjab during the Rabi dry season. Adapt the geometry and date range for your study area.
// Define AOI, replace with your Punjab district geometry
var aoi = ee.FeatureCollection('FAO/GAUL/2015/level2')
             .filter(ee.Filter.eq('ADM1_NAME', 'Punjab'))
             .filter(ee.Filter.eq('ADM0_NAME', 'India'));

// Load Sentinel-2 SR, filter by date and cloud cover
var s2 = ee.ImageCollection('COPERNICUS/S2_SR_HARMONIZED')
  .filterBounds(aoi)
  .filterDate('2023-11-01', '2024-02-28')
  .filter(ee.Filter.lt('CLOUDY_PIXEL_PERCENTAGE', 10))
  .median()
  .clip(aoi);

// Scale reflectance (S2 SR values are scaled by 10000)
var scaled = s2.divide(10000);

// Compute NDSI: (Red - NIR) / (Red + NIR)
// Sentinel-2: Red = B4, NIR = B8
var ndsi = scaled.normalizedDifference(['B4', 'B8']).rename('NDSI');

// Compute RNDSI: (SWIR1 - Green) / (SWIR1 + Green)
// Sentinel-2: SWIR1 = B11 (20m), Green = B3
var rndsi = scaled.normalizedDifference(['B11', 'B3']).rename('RNDSI');

// Stack indices
var indices = ndsi.addBands(rndsi);

// Visualise NDSI
Map.centerObject(aoi, 8);
Map.addLayer(ndsi, {min: -0.3, max: 0.3, palette: ['blue','white','red']}, 'NDSI');
Map.addLayer(rndsi, {min: -0.2, max: 0.4, palette: ['green','yellow','brown']}, 'RNDSI');

// Export for further analysis
Export.image.toDrive({
  image: indices,
  description: 'Punjab_Salinity_Indices_Rabi2023',
  region: aoi.geometry(),
  scale: 20,
  crs: 'EPSG:32643'
});
A few implementation notes:
- Band B11 is 20 m - GEE will resample automatically when you stack with 10 m bands, but be explicit about your export scale.
- Median compositing over three months suppresses cloud shadows and reduces noise from transient moisture events.
- Negative NDSI values typically indicate vegetation or moisture; high positive values in bare-soil areas are the salinity signal of interest.
Once you have the index layers, the next step is calibrating against field EC measurements (electrical conductivity, in dS/m) to build a regression or Random Forest model, that is where the FAO's new guidance on algorithms becomes directly applicable.
Uncertainty and What the Indices Cannot Tell You
Three-dimensional salinity mapping research published in Agricultural Water Management highlights a point worth internalising: surface spectral indices capture the top few centimetres of soil, but salinity is often a subsurface phenomenon driven by groundwater depth and irrigation practices. A study on 3D salinity mapping with uncertainty quantification found that integrating depth-specific field samples with remote sensing covariates substantially improved prediction at the profile level.
For operational monitoring in India, particularly in waterlogged areas of Haryana or the Sundarbans coastal fringe, this means remote sensing indices are best treated as screening layers that guide where intensive field sampling is most needed, not as a substitute for it.
Scaling Up: What the Market and Policy Context Mean for Practitioners
The satellite Earth observation market is projected to grow from $10.76 billion in 2026 to $18.37 billion by 2034, at a CAGR of 6.92%. That growth means more commercial high-resolution imagery will become accessible, and the analytical pipelines you build in GEE today will be directly transferable to those datasets. The FAO's renewed institutional focus on digital soil monitoring signals that funding and policy frameworks for this work are aligning, a good moment to have a working methodology already in hand.
Frequently asked questions
Which remote sensing index is most sensitive to bare salt crusts?
The Salinity Index (SI), calculated as the square root of Red times Green reflectance, is the index specifically noted as sensitive to bare salt crusts on the soil surface.
What time of year is best for mapping soil salinity in the Indo-Gangetic Plain with satellite imagery?
Filter Sentinel-2 imagery to the Rabi season, November to February, for the Indo-Gangetic Plain, since bare salt-affected fields are most exposed and spectrally distinct during this dry period.
Can surface reflectance indices detect subsurface soil salinity?
Not fully; surface spectral indices only capture the top few centimetres of soil, while salinity is often a subsurface phenomenon driven by groundwater depth, so indices work best as screening layers guiding field sampling.
Which dataset is better for a long multi-year soil salinity trend analysis in India, Sentinel-2 or Landsat?
Landsat 8/9 Surface Reflectance is better suited to multi-year trend analysis because its archive goes back to 2013, even though its 30 m resolution is coarser than Sentinel-2's 10-20 m bands.
References
- FAO - Digital mapping of soil salinity: tools, algorithms and practical applications: https://www.fao.org/global-soil-partnership/resources/events/detail/ar/c/1759034/
- Temporal remote sensing based soil salinity mapping in Indo-Gangetic Plain (ResearchGate): https://www.researchgate.net/publication/369377549_Temporal_remote_sensing_based_soil_salinity_mapping_in_Indo-Gangetic_plain_employing_machine-learning_techniques
- Assessment of soil salinity using AI and Sentinel-2B (Taylor & Francis): https://www.tandfonline.com/doi/full/10.1080/02723646.2025.2541644?src=
- Global Soil Salinity Estimation at 10 m - FAO GSID24 Presentation: https://www.fao.org/fileadmin/user_upload/GSP/GSID24/Presentations/Day_1_Parallel_session_3/03_Nan_WANG_sub_theme_2.1_Global_soil_salinity_estimation_at_10_m_using_multisource_remote_sensing.pdf
- Sentinel-2 Index Database (Sentinel Hub): https://custom-scripts.sentinel-hub.com/custom-scripts/sentinel-2/indexdb/
- Unlocking Soil Salinity Prediction With Remote Sensing Indices (Wiley): https://onlinelibrary.wiley.com/doi/10.1002/ldr.5694
- Three-dimensional soil salinity mapping with uncertainty (ScienceDirect): https://www.sciencedirect.com/science/article/pii/S0378377425000320
- Satellite Earth Observation Market Report (Straits Research): https://straitsresearch.com/report/satellite-earth-observation-market
Researched and drafted with AI assistance.
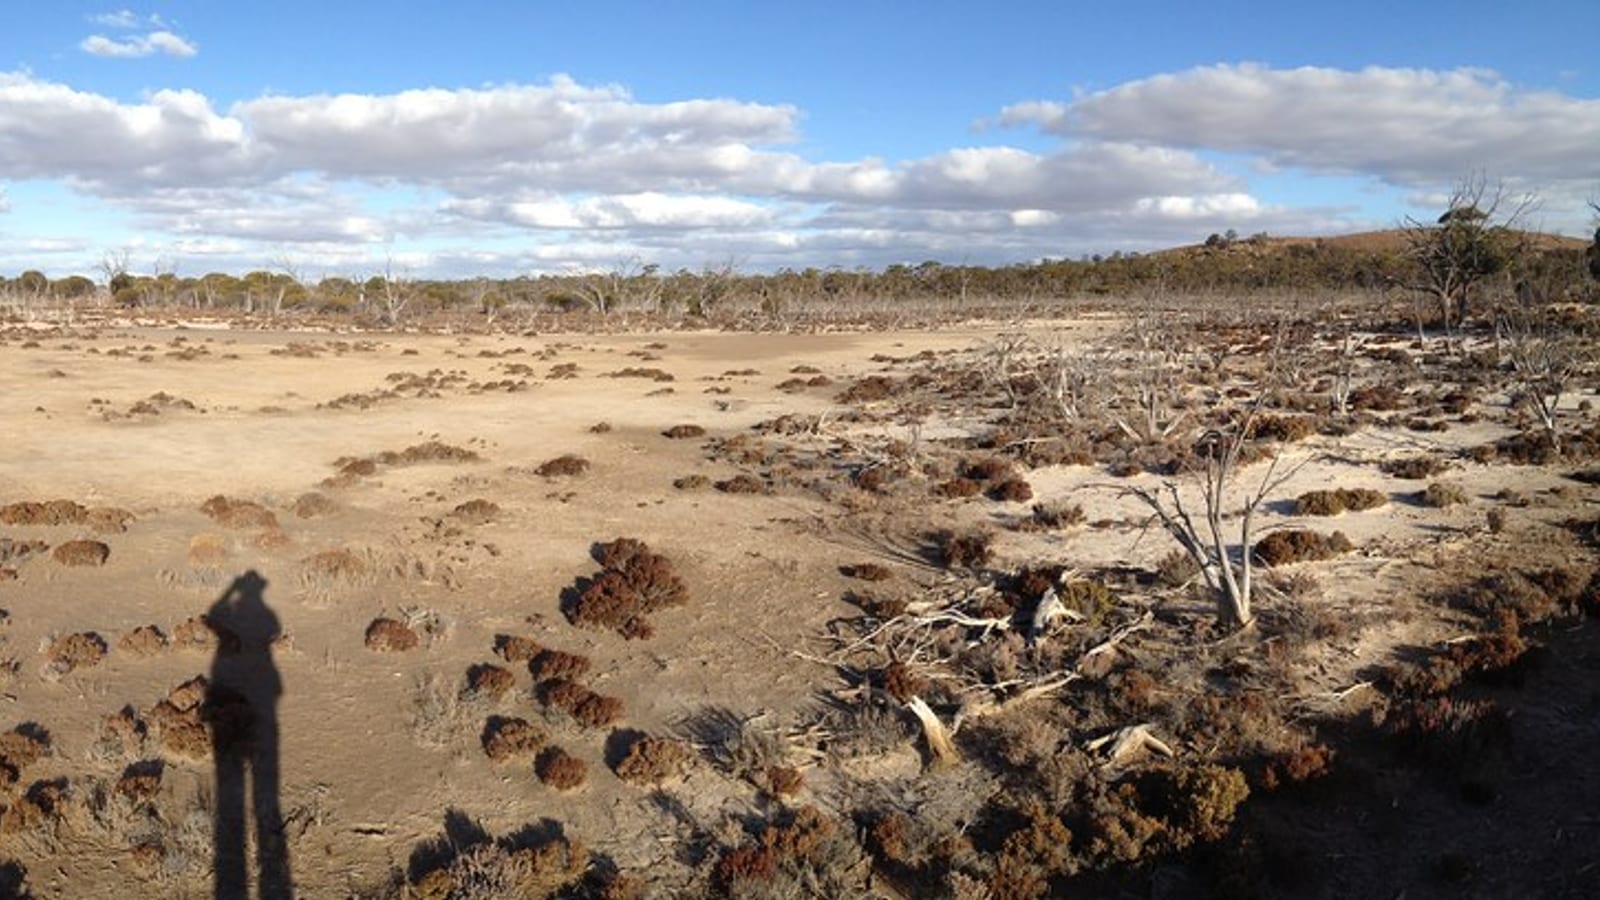
Hero image: "Rising salt" by sridgway is licensed under CC BY 2.0. To view a copy of this license, visit https://creativecommons.org/licenses/by/2.0/.