NDVI Time-Series Analysis in GEE: Detecting Seasonal Crop Cycles
A technical walkthrough of building NDVI time-series workflows in Google Earth Engine to detect kharif, rabi, and zaid crop cycles across Indian agricultural landscapes, covering collection setup, cloud masking, and phenology curve extraction.
Why Seasonal Crop Monitoring Needs Multi-Temporal NDVI
If you work in agricultural remote sensing in India, you already know the rhythm: kharif crops go in after the southwest monsoon breaks in June–July, rabi crops follow after October, and somewhere in between there is a zaid season that most monitoring workflows quietly ignore. The challenge is not detecting a single crop, it is capturing the full phenological arc of each season, repeatedly, across millions of hectares.
This is exactly where NDVI time series Google Earth Engine workflows earn their place. A single Sentinel-2 or Landsat scene tells you what the vegetation looks like on one date. A dense time series tells you when the canopy closes, when it peaks, when it senesces, and that temporal signature is what separates wheat from mustard, or a healthy kharif paddy field from one that experienced a mid-season dry spell.
Indian agricultural agencies, state remote sensing centres, and university research groups are increasingly expected to produce seasonal crop maps and anomaly reports. Yet most tutorials stop at computing NDVI for one image. This post walks through the logic of a multi-temporal NDVI workflow in GEE end-to-end, with enough detail to adapt it to your own study area.
What Is an NDVI Time Series and Why Does It Reveal Crop Cycles?
NDVI (Normalized Difference Vegetation Index) is calculated as (NIR − Red) / (NIR + Red). Values range from roughly −0.1 (bare soil or water) to around 0.9 (dense, healthy canopy). The index itself is decades old, but its power in crop monitoring comes from repetition.
When you stack NDVI values from every available cloud-free image over a growing season, you get a phenology curve: a slow rise as seedlings emerge, a plateau during peak vegetative growth, and a decline as the crop matures and dries. Each crop type has a characteristic curve shape and timing. Paddy in the Indo-Gangetic Plain peaks earlier in the kharif season than sugarcane does. Wheat in Punjab shows a sharp, narrow peak in February–March. These signatures are detectable even at moderate spatial resolution.
The key insight is that temporal patterns are often more diagnostic than spectral values at a single date. Two fields can have nearly identical NDVI on a given day but completely different crop types if their seasonal trajectories differ.
Setting Up the Image Collection in Google Earth Engine
GEE's cloud-computing environment is well-suited to this task because it holds global archives of Landsat (going back to the 1970s) and Sentinel-2 (from 2015 onward), and it lets you filter, process, and reduce those archives without downloading anything locally.
A typical setup for kharif season monitoring over an Indian district might look like this in concept:
- Define your region of interest (ROI), a district boundary, a tehsil, or a custom polygon drawn in the GEE code editor.
- Filter the image collection by date, for kharif, roughly June 1 to November 30; for rabi, November 1 to April 30.
- Filter by cloud cover, use the
CLOUD_COVERproperty for Landsat orCLOUDY_PIXEL_PERCENTAGEfor Sentinel-2 to keep only relatively clear scenes (commonly a threshold of 20–30% is used as a starting point, though you will tighten this for optical-only workflows in high-rainfall zones). - Apply a cloud mask, collection-level cloud filtering is coarse; pixel-level masking using QA bands (Landsat's
QA_PIXELband or Sentinel-2'sQA60band) removes residual cloud and shadow pixels before computing NDVI. - Map NDVI computation over the collection - GEE's
.map()function applies a function to every image in the collection, returning a new collection of NDVI images with the acquisition date preserved as a property.
The result is an ImageCollection where each image is a single-band NDVI raster tagged with its date, the raw material for time-series analysis.
Building and Smoothing the Time-Series Profile
Once you have a dated NDVI collection, you can extract a profile for any pixel or polygon using .reduceRegion() or the ui.Chart.image.series() function, which plots mean NDVI over time directly in the GEE code editor.
In practice, optical time series over India are gappy. The monsoon months (June–September) that are most critical for kharif monitoring are also the cloudiest. Strategies to handle this include:
- Temporal compositing: create 16-day or monthly median composites to fill gaps and reduce noise. Median compositing is generally preferred over mean for NDVI because it is more robust to residual cloud contamination.
- Savitzky-Golay or LOESS smoothing: these filters smooth the noisy raw profile into a cleaner phenology curve. GEE does not have a native Savitzky-Golay function, but it can be implemented with array operations, or you can export the time-series table and smooth it in Python with
scipy. - Combining SAR and optical: Sentinel-1 SAR data is cloud-independent and can fill temporal gaps in optical NDVI series. Backscatter from SAR does not equal NDVI, but fusing both can improve crop-type classification when optical data is sparse.
A Worked Example: Detecting Kharif Paddy in a Punjab District
Suppose you want to identify paddy-growing pixels in Ludhiana district for the 2023 kharif season. Here is the logical workflow:
- Load Sentinel-2 Surface Reflectance collection, filter to Ludhiana boundary, June 1 – November 15, 2023, cloud cover < 30%.
- Apply the
QA60cloud mask, compute NDVI for each image. - Create 16-day median composites, you will likely get 8–10 composites for the season.
- Extract the NDVI profile for the district (mean per composite date).
- Look for pixels where NDVI rises above roughly 0.4 by late July (transplanting complete), peaks above 0.6–0.7 in August–September (vegetative maximum), then drops sharply by October–November (harvest). This temporal shape, rapid rise, high sustained plateau, sharp fall, is characteristic of transplanted paddy.
- Apply a simple threshold rule or train a random forest classifier using this multi-date NDVI stack as input features.
The classifier trained on multi-date features will substantially outperform one trained on a single date because it encodes phenological timing, not just spectral brightness.
Common Pitfalls to Avoid
Ignoring the projection: GEE works in a geographic coordinate system by default. When computing areas or exporting rasters for India, reproject explicitly to a suitable UTM zone (e.g., UTM 44N or 43N for northern India) to avoid area distortions.
Over-relying on NDVI alone: In areas with mixed crops or complex land use, NDVI time series alone may conflate spectrally similar crops. Adding EVI (Enhanced Vegetation Index) or LSWI (Land Surface Water Index, sensitive to leaf water content and useful for paddy detection) improves separability.
Not accounting for inter-annual variability: A monsoon onset that is two weeks late shifts the entire kharif phenology curve. If you are comparing 2023 to 2019, align curves by growing-degree days or relative phenological stage rather than calendar date.
Memory limits in GEE: Dense time series over large areas can hit GEE's memory ceiling. Break your analysis into smaller tiles or use Export.image.toDrive() to move heavy computations to batch tasks.
Where to Take This Next
A multi-temporal NDVI stack is the foundation for several downstream analyses that are increasingly relevant to Indian agricultural policy:
- Crop area estimation at district and state level for kharif and rabi separately
- Yield anomaly detection by comparing current-season NDVI to a multi-year baseline
- Irrigation mapping by identifying green pixels in the dry rabi season in otherwise rain-fed landscapes
- Double-cropping intensity mapping, detecting pixels that show two distinct phenology peaks in a single year
Each of these is a meaningful research or operational product, and each starts with the same time-series NDVI collection you build in the steps above.
The GEE platform has lowered the barrier to doing this work considerably. The conceptual investment, understanding phenology, cloud masking, compositing logic, and classification design, is where the real skill lies, and it is transferable across sensors and seasons.
Frequently asked questions
What NDVI value signals that kharif paddy transplanting is complete?
NDVI rising above roughly 0.4 by late July indicates transplanting is complete for kharif paddy, with values later peaking above 0.6 to 0.7 in August to September during the vegetative maximum.
Why isn't a single NDVI image enough to tell crops apart?
Two fields can show nearly identical NDVI on one date but have completely different crop types, because temporal patterns across a growing season are often more diagnostic of crop identity than spectral values from a single date.
Why do optical NDVI time series have gaps during the Indian monsoon?
The June to September monsoon months, which are most critical for kharif crop monitoring, are also the cloudiest, leaving optical satellites like Sentinel-2 and Landsat with sparse cloud-free acquisitions exactly when conditions are changing fastest.
Which UTM zone should be used when reprojecting NDVI data for northern India?
For northern India, reproject explicitly to UTM zone 44N or 43N before computing areas or exporting rasters, since Google Earth Engine's default geographic coordinate system distorts area calculations.
References
- Google Earth Engine Documentation, https://developers.google.com/earth-engine
- Sentinel-2 MSI User Guide, ESA, https://sentinel.esa.int/web/sentinel/user-guides/sentinel-2-msi
- USGS Landsat Collection 2, https://www.usgs.gov/landsat-missions/landsat-collection-2
- ISRO / NRSC Bhuvan Crop Monitoring Resources, https://bhuvan.nrsc.gov.in
Researched and drafted with AI assistance.
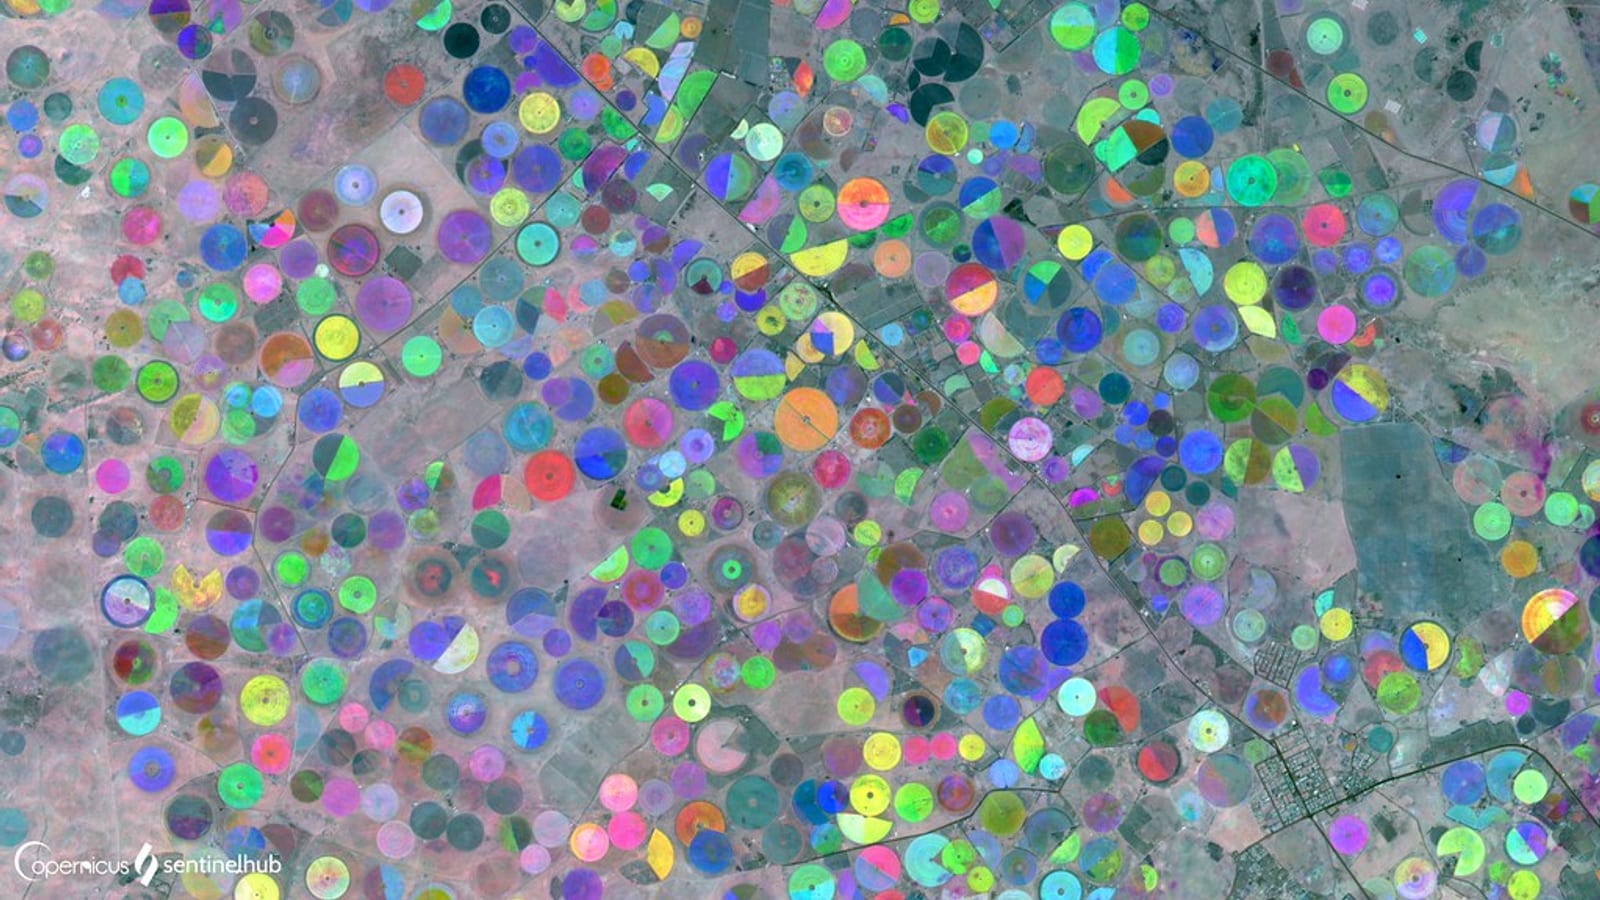
Hero image: "Seasonal NDVI Changes in Saudi Arabia Crops" by SentinelHub is licensed under CC BY 2.0. To view a copy of this license, visit https://creativecommons.org/licenses/by/2.0/.