Optical vs SAR Flood Mapping: Choosing the Right Satellite Data
SAR or optical imagery for flood mapping in India? This article breaks down the decision logic, cloud cover, terrain, timing, and use case, with evidence from Sentinel-1 and Sentinel-2 studies across Indian flood-prone regions.
Why the Sensor Choice Matters More Than Ever
Three days ago, the United Nations University published a piece on how satellites and AI are reshaping climate resilience in extreme environments, framing rapid flood detection as one of the clearest wins for digital technology in disaster response. As these tools scale, from national disaster agencies to district-level planners, a practical question keeps coming up in workshops and project proposals: should I use SAR or optical imagery for this flood map?
The honest answer is that it depends on your cloud situation, your timeline, your terrain, and what you're actually trying to measure. This article walks through the decision logic I use, grounded in what the research actually shows for Indian conditions.
What Are We Actually Mapping?
Before comparing sensors, it helps to be precise about the task. Flood extent mapping means delineating the boundary between inundated and non-inundated land at a specific moment. That's different from flood depth modelling or flood risk assessment, though those build on it.
Both Sentinel-1 (SAR, C-band, free access) and Sentinel-2/Landsat (multispectral optical) are widely used for this. India's flood-prone landscape, the Ganga-Brahmaputra plains, coastal Odisha and Andhra Pradesh, Kerala's backwaters, has been a testing ground for both approaches. A multi-sensor study on flood and drought monitoring across India noted that water has a distinct spectral signature in the NIR band, which underpins most optical flood indices, while SAR exploits the specular reflection of smooth open water surfaces that dramatically lowers backscatter values.
Why SAR Wins During Active Monsoon Events
This is the core practical reality for anyone working in India: the monsoon and cloud cover arrive together. When a flood is actively unfolding in July or August, Sentinel-2 and Landsat scenes over Bihar, Assam, or coastal Andhra are almost always cloud-contaminated. SAR sees through cloud, rain, and darkness.
A study mapping Patna's 2023 monsoon flooding using Sentinel-1 reported overall accuracy of 94.3% and 94.1% for flood inundation maps on two separate acquisition dates in August 2018, strong performance for near-real-time operational use. The approach used change detection: comparing a pre-flood SAR backscatter baseline against the flood-period image, flagging pixels where backscatter dropped sharply as inundated.
Research on Sentinel-1 change detection approaches confirms that this backscatter decrease method is the most widely implemented technique, though it requires a good pre-event reference image, something to plan for before the monsoon season starts, not after.
Where Optical Data Still Has an Edge
SAR isn't universally superior. Three situations where optical data earns its place:
1. Post-event damage assessment with clear skies Once the active flood pulse passes and skies clear, often within days in semi-arid parts of Rajasthan or Gujarat - Sentinel-2's 10 m multispectral bands let you run NDWI (Normalized Difference Water Index) or MNDWI quickly and interpret results visually alongside RGB composites. Optical indices are also easier to explain to non-specialist stakeholders.
2. Vegetation and land-cover context Optical imagery gives you NDVI alongside water indices in the same acquisition. This matters when you're trying to distinguish flooded cropland from flooded fallow land for agricultural loss estimation, a common requirement for state disaster relief funds in India.
3. Shallow or turbid floodwater in complex terrain SAR can struggle with shallow inundation under dense vegetation canopy (the double-bounce and volume scattering effects complicate interpretation) and with wind-roughened water surfaces that raise backscatter and mimic dry land. A case study at Lake Vembanad, Kerala used multi-spectral remote sensing to map flooded areas in the wetland system, where the optical approach worked well because the post-flood observation window had adequate clear-sky coverage.
A Worked Decision Framework
Here's the logic I apply at the start of a flood mapping project. Run through these questions in order:
-
Is the flood actively occurring or ongoing?
- Yes → go to question 2
- No (post-event, >5 days) → optical is viable if skies are clear; use Sentinel-2 NDWI
-
What is the cloud cover over the study area?
-
30% cloud cover in available optical scenes → use Sentinel-1 SAR
- <30% cloud cover → optical is viable; consider fusing both
-
-
What is the land cover type?
- Open agricultural plains, urban areas, rivers → SAR change detection works well
- Dense forest or mangrove → SAR interpretation is harder; optical or fusion preferred
-
Do you have a pre-event SAR baseline?
- Yes → change detection is your most reliable SAR approach
- No → threshold-based SAR methods (single-image) are less accurate; optical may be safer if available
-
What is your accuracy requirement?
- Operational emergency response → SAR speed and cloud penetration usually wins
- Scientific study or damage assessment → consider fusing both; a study combining optical and SAR showed that integrating Sentinel-1 with optical data improved flood extent extraction compared to either sensor alone
Classification Methods: What the Research Shows
Sensor choice is only half the decision. The classification algorithm matters too. A comparative analysis of six classification techniques for flood mapping, including Index Approach, Expectation-Maximization clustering, K-means, and Random Forest, found that performance varied significantly by land cover complexity and input data type. For routine operational mapping, simpler threshold-based methods on SAR data are fast and reproducible. For accuracy-critical applications, machine learning classifiers on multi-sensor inputs tend to perform better, though they need training data.
The Sentinel-1 for arid and semi-arid flood detection study is worth reading if your work covers Rajasthan, parts of Gujarat, or the Deccan Plateau, it specifically addresses the challenge of dry, rough soil surfaces that can produce low backscatter and be misclassified as water, a false-positive problem that's less common in wetter Indian landscapes but still relevant.
The Fusion Argument
Increasingly, the practical answer isn't "SAR or optical" but "SAR then optical", using SAR for near-real-time delineation during the event and optical for post-event validation and damage characterisation once clouds clear. The multi-sensor satellite data study on Indian flood hazard made this case for India's major flood-prone regions, showing that no single sensor captures the full picture across the country's diverse geographies.
The UNU piece frames this well at the policy level: timely decisions require timely data, and that increasingly means combining sensor types rather than committing to one.
Practical Takeaways for Indian Practitioners
- Download your pre-monsoon Sentinel-1 baseline scenes now (May–June), before the flood season. Change detection is far more reliable with a clean reference.
- Sentinel-1 IW mode, VV polarisation is the standard starting point for open-water flood mapping in India. VH can help in vegetated areas.
- Google Earth Engine has both Sentinel-1 and Sentinel-2 archives with reasonable preprocessing, the SAR data comes as GRD products already terrain-corrected.
- For Kerala backwaters, Sundarbans, or any mangrove/wetland context, validate your SAR results against optical where possible; these landscapes are genuinely hard for single-sensor SAR approaches.
- Document your cloud cover in any optical-based flood map you publish. A map with 40% cloud cover is not the same as one with 5%, and reviewers and agencies need to know.
Frequently asked questions
Why is SAR preferred over optical imagery for flood mapping during India's monsoon?
SAR can see through cloud, rain, and darkness, while Sentinel-2 and Landsat scenes over flood-hit regions like Bihar or Assam are almost always cloud-contaminated when a flood is actively unfolding in the monsoon.
How accurate was Sentinel-1 SAR at mapping the Patna monsoon flood?
A study mapping Patna's monsoon flooding using Sentinel-1 change detection reported overall accuracy of 94.3% and 94.1% for flood inundation maps on two separate August 2018 acquisition dates.
At what cloud cover percentage should you switch from optical to SAR for flood mapping?
If available optical scenes have more than 30% cloud cover, SAR should be used; below 30% cloud cover, optical imagery is viable and can even be fused with SAR data.
Which Sentinel-1 mode and polarisation is standard for open-water flood mapping in India?
Sentinel-1 IW mode with VV polarisation is the standard starting point for mapping open water floods, while VH polarisation is useful for detecting flooding in vegetated areas.
References
- From Satellites to AI: How Digital Technologies Are Reshaping Climate Resilience - UNU
- Unlocking the full potential of Sentinel-1 for flood detection in arid regions - ScienceDirect
- Comparative analysis of classification techniques for flood mapping - Springer
- Quantifying Spatiotemporal Variability of Patna's 2023 Monsoon Flooding, ISPRS Archives
- Rapid Flood Mapping with Supervised Classifier and Sentinel-1 - MDPI Remote Sensing
- An Intercomparison of Sentinel-1 Based Change Detection Algorithms - TU Wien / Remote Sensing
- Potentiality of Multi-Sensor Satellite Data in Mapping Flood Hazard in India - Springer
- Multi-Spectral Remote Sensing for Flood Mapping: Lake Vembanad, India - MDPI
- Use of Multi-Sensor Satellite Data for Flood and Drought Monitoring in India - Springer
Researched and drafted with AI assistance.
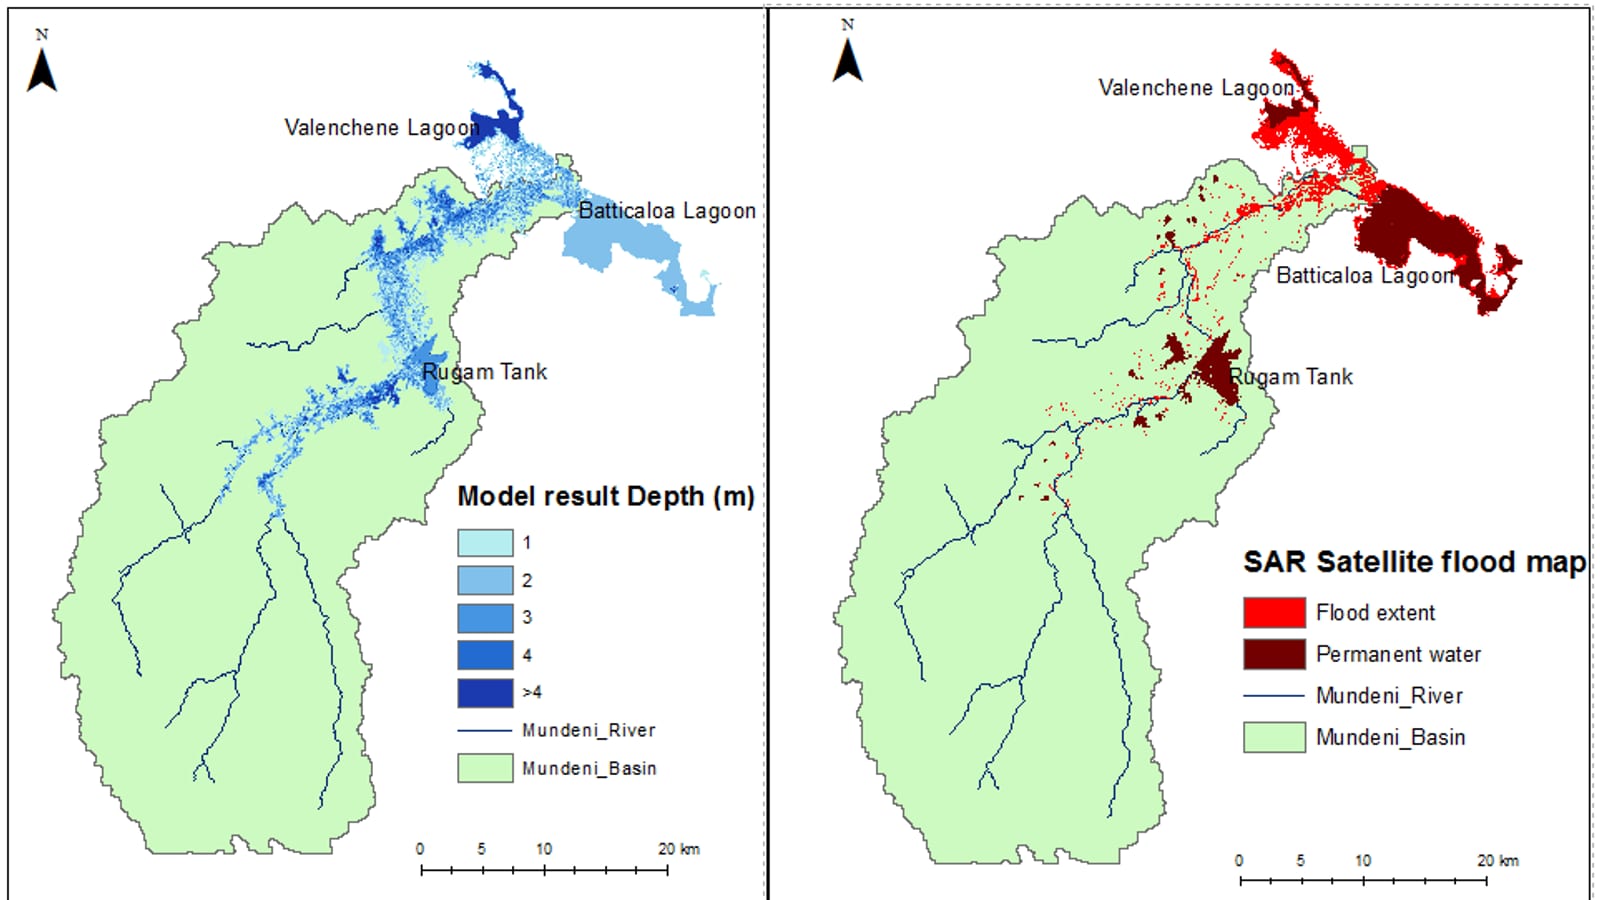
Hero image: "Flood-inundation-maps-for-the-Mundeni-Aru-River-Basin" by G. Amarnath, Y. M. Umer, N. Alahacoon, Y. Inada is licensed under CC BY 3.0. To view a copy of this license, visit https://creativecommons.org/licenses/by/3.0/.