Mapping Reservoir Storage Changes with NDWI and Landsat in GEE
A step-by-step guide to mapping seasonal reservoir storage changes across India using NDWI and Landsat imagery in Google Earth Engine, with honest notes on turbidity, cloud shadow, and threshold validation.
Why Reservoir Monitoring Matters More Than Ever in India
Every April and May, the same anxiety grips water managers across peninsular India: reservoirs that were brimming after October's retreat of the monsoon are now at their lowest, and the next rain is still weeks away. The gap between what a gauge network reports and what is actually happening across hundreds of small and medium reservoirs is often enormous, many of these structures simply have no telemetry at all.
Satellite-derived surface water mapping offers a practical way to close that gap. Using NDWI reservoir mapping in Google Earth Engine, a researcher or water department analyst can track how a reservoir's surface area changes across seasons, and by extension, make rough inferences about storage, using freely available Landsat imagery and a cloud-based processing environment that requires no local hardware. This article walks through the logic, the workflow, and the honest limitations of that approach.
What Is NDWI and Why Does It Work for Reservoirs?
The Normalized Difference Water Index (NDWI) was formulated to isolate open water bodies from surrounding land cover using reflectance in the green and near-infrared (NIR) bands:
NDWI = (Green − NIR) / (Green + NIR)
Water absorbs strongly in the NIR and reflects moderately in the green, so water pixels produce positive NDWI values (typically above 0.0 to 0.3 depending on turbidity and depth), while vegetation and bare soil produce negative values. For reservoirs, which are spectrally "clean" open water compared to wetlands or river channels, the index performs reliably even at Landsat's 30-metre resolution.
A few practical notes:
- Turbid water (common in Indian reservoirs after heavy inflow events) can lower NDWI values and cause underestimation of water extent.
- Shallow margins near the reservoir edge may be misclassified, especially when the water is very shallow and bottom reflectance bleeds through.
- Cloud shadow mimics water spectrally and is one of the most common sources of false positives in monsoon-season imagery.
These are not reasons to avoid NDWI, they are reasons to build quality filters into your workflow.
Setting Up the Workflow in Google Earth Engine
Google Earth Engine (GEE) gives you access to the full Landsat archive (Landsat 5, 7, 8, and 9) through a browser-based code editor, with no data download required. Here is a condensed version of a working approach for a single reservoir:
1. Define your area of interest (AOI) Draw a polygon around your reservoir with a generous buffer, enough to capture the maximum possible water extent at full storage. In the GEE Code Editor:
var aoi = ee.Geometry.Polygon([...your coordinates...]);
2. Filter the image collection For a pre-monsoon vs. post-monsoon comparison, filter by date range and cloud cover. Landsat 8 Collection 2 Surface Reflectance is a good default:
var collection = ee.ImageCollection('LANDSAT/LC08/C02/T1_L2')
  .filterBounds(aoi)
  .filterDate('2023-02-01', '2023-04-30')
  .filter(ee.Filter.lt('CLOUD_COVER', 10));
3. Compute NDWI per image Landsat 8 Band 3 is green, Band 5 is NIR:
var addNDWI = function(image) {
  var ndwi = image.normalizedDifference(['SR_B3', 'SR_B5']).rename('NDWI');
  return image.addBands(ndwi);
};
var withNDWI = collection.map(addNDWI);
4. Apply a threshold and compute water area A threshold of 0.0 is a common starting point, but you should visually validate it against a known high-resolution basemap:
var waterMask = withNDWI.median().select('NDWI').gt(0.0);
var waterArea = waterMask.multiply(ee.Image.pixelArea())
  .reduceRegion({reducer: ee.Reducer.sum(), geometry: aoi, scale: 30})
  .get('NDWI');
5. Repeat for post-monsoon (October–November) and compare The difference in computed water area between the two seasons gives you a proxy for how much the reservoir filled. If you have historical storage-area curves (often available from state irrigation departments or dam safety reports), you can convert area to approximate volume.
Interpreting the Seasonal Signal
The real value of this approach is not a single snapshot but a time series. Running the workflow across monthly composites from 2015 to the present reveals patterns that in-situ data often cannot: which reservoirs recover quickly after a weak monsoon, which ones are structurally losing storage capacity over years (possibly due to sedimentation), and how inter-annual variability in rainfall propagates into storage.
For Indian reservoirs, a few seasonal patterns are worth knowing before you interpret results:
- June–July: Cloud cover is severe; usable Landsat scenes may be sparse or absent for many reservoirs. Consider Sentinel-1 SAR for this window.
- October–November: Typically the clearest post-monsoon window with maximum storage; ideal for annual "peak storage" mapping.
- February–April: Pre-monsoon minimum; best window to estimate dead storage and identify sedimentation in shallow areas.
A time series that shows steadily declining peak-season water area over a decade, even after accounting for variable monsoon rainfall, is a flag worth investigating further. It may indicate sedimentation reducing live storage, or increased upstream abstraction.
Honest Limitations to Communicate to Stakeholders
If you are presenting this analysis to a water department or NGO, be clear about what NDWI surface area mapping is and is not:
- It measures surface area, not volume. Converting area to storage requires a hypsometric (area-elevation) curve for each reservoir, which may not be publicly available.
- 30-metre resolution sets a minimum detectable change. For small tanks (under 5–10 hectares), Landsat is too coarse; Sentinel-2 at 10 metres is more appropriate.
- Monsoon-season gaps are real. A cloud-free image during peak monsoon is rare for many parts of India. Your time series will have gaps precisely when storage is changing most rapidly.
- NDWI does not distinguish between a full reservoir and a flooded field. Post-processing with a permanent water mask (such as the JRC Global Surface Water dataset, available directly in GEE) helps constrain results to known water body footprints.
Despite these caveats, the approach is genuinely useful, particularly for reservoirs where no gauge data exists at all. An imperfect satellite estimate, consistently applied, is often more actionable than no data.
A Quick Validation Approach
If you have even a few months of gauge or storage records for a reservoir, use them. Plot NDWI-derived water area against reported storage levels for those months. A strong correlation (even if the absolute numbers differ) tells you that your area estimates are tracking real storage dynamics. You can then use that relationship to extrapolate storage estimates for periods without gauge data.
This kind of informal validation is especially important before sharing results with decision-makers. It converts your analysis from "here is a map" to "here is a map we have reason to trust."
Getting Started: What You Actually Need
- A Google account with GEE access (free for research and non-commercial use; apply at earthengine.google.com)
- The reservoir's approximate boundary (a rough polygon is enough to start)
- Familiarity with basic JavaScript or the GEE Python API
- Optionally: the JRC Global Surface Water layer for masking, and any available storage records for validation
The learning curve for GEE is real but manageable. The GEE Developers documentation and the community forum are both active and genuinely helpful for beginners.
Frequently asked questions
What NDWI threshold is used to classify open water in a reservoir?
A starting threshold of 0.0 is commonly applied to NDWI composites to classify open water, though it should be visually validated against a high-resolution basemap, since water pixels typically show values from about 0.0 to 0.3.
Can NDWI directly tell you how much water is stored in a reservoir?
No, NDWI only measures surface area, not volume. Converting area to storage requires a hypsometric (area-elevation) curve for the specific reservoir, which may not be publicly available.
Why is Landsat unsuitable for monitoring small reservoirs or tanks?
Landsat's 30-metre resolution sets a minimum detectable change that is too coarse for small tanks under 5 to 10 hectares. Sentinel-2, at 10-metre resolution, is more appropriate for those smaller water bodies.
When is the best time of year to estimate a reservoir's minimum storage in India?
February to April is the pre-monsoon minimum period and the best window to estimate dead storage and identify sedimentation in shallow areas, before the next monsoon inflow begins.
References
- Google Earth Engine platform: https://earthengine.google.com
- JRC Global Surface Water Explorer: https://global-surface-water.appspot.com
- USGS Landsat Collection 2 documentation: https://www.usgs.gov/landsat-missions/landsat-collection-2
- GEE Developer documentation: https://developers.google.com/earth-engine
Researched and drafted with AI assistance.
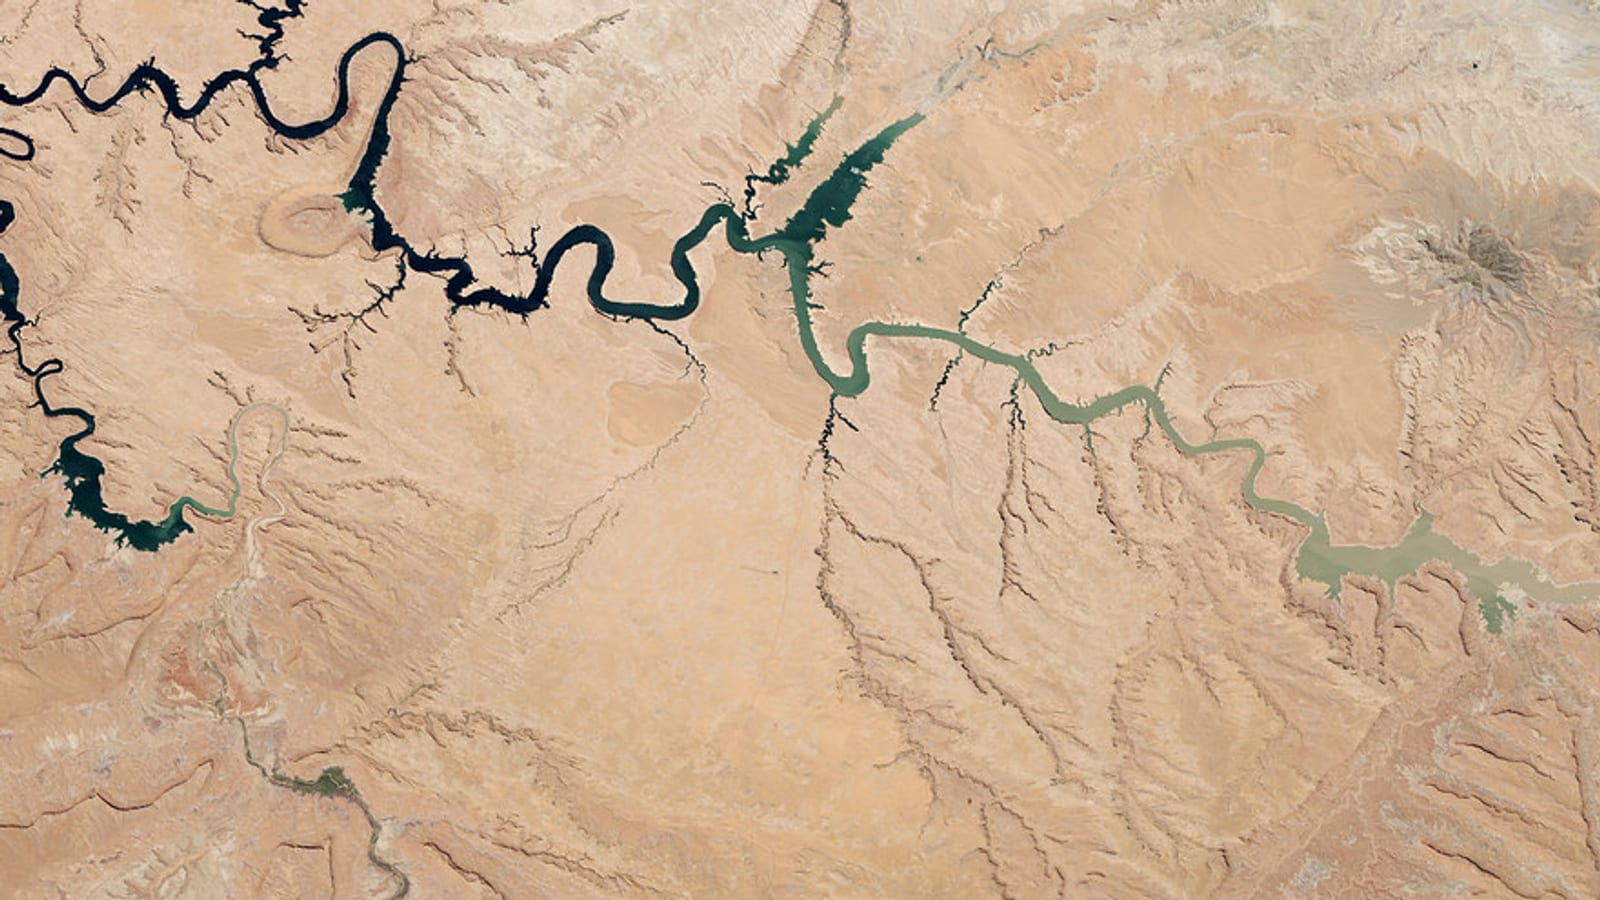
Hero image: "Lake Powell Half Empty" by NASA Goddard Photo and Video is licensed under CC BY 2.0. To view a copy of this license, visit https://creativecommons.org/licenses/by/2.0/.