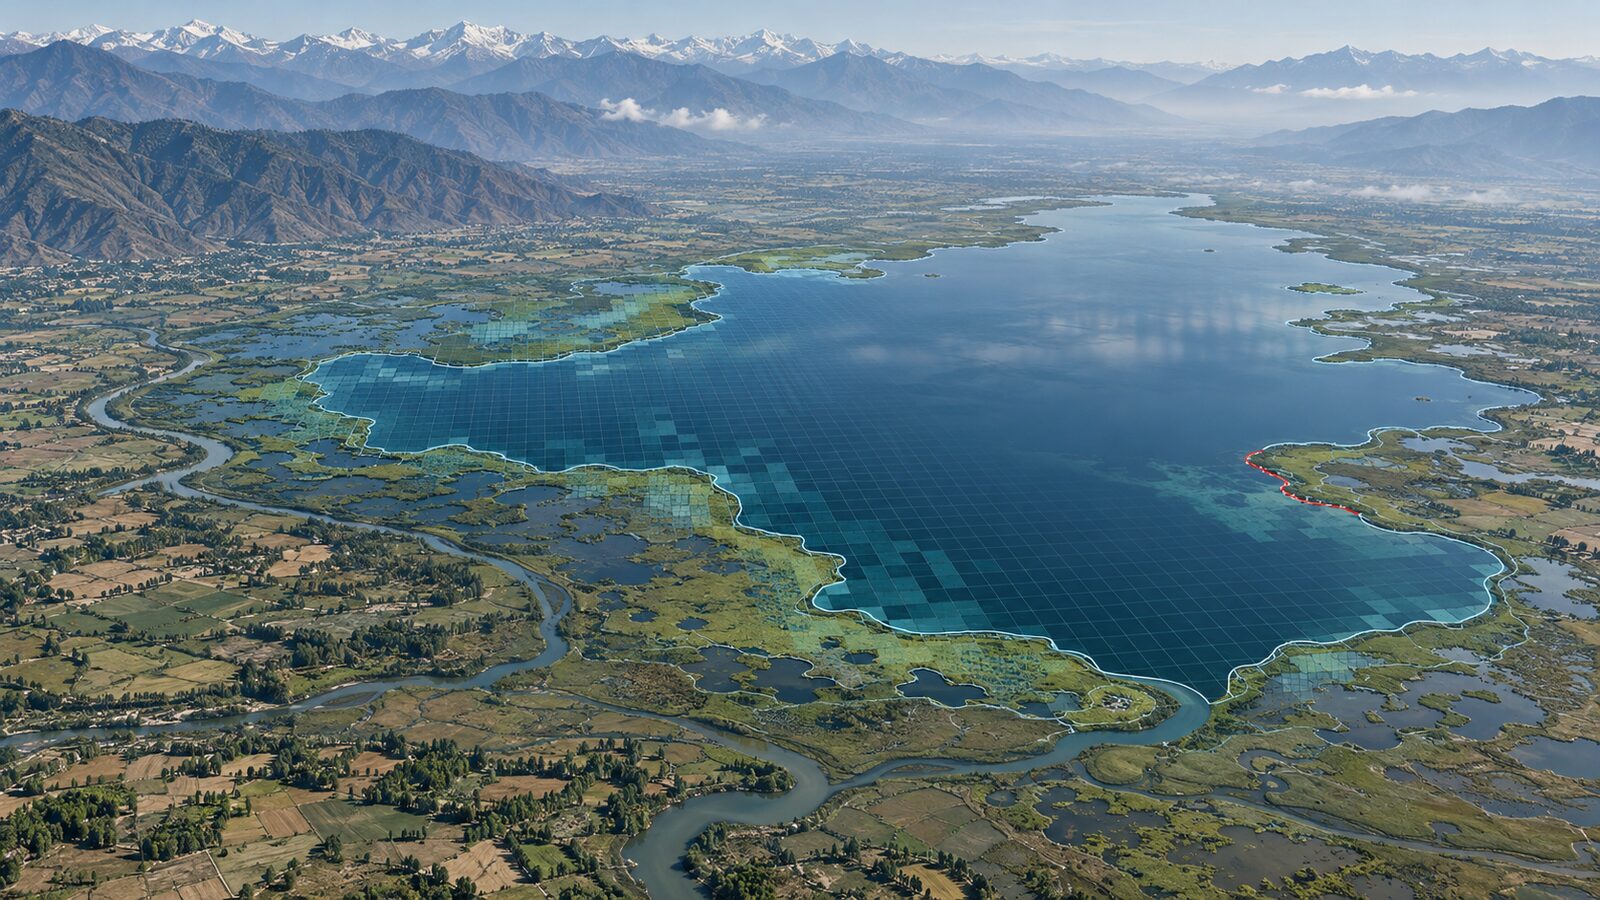
Detecting Saltwater Intrusion in Coastal Aquifers with Remote Sensing
A practical walkthrough of how satellite sensors, InSAR, and EMI surveys detect saltwater intrusion in India's coastal aquifers across Gujarat, Tamil Nadu, Kerala, and Odisha, and where each method's limits lie.
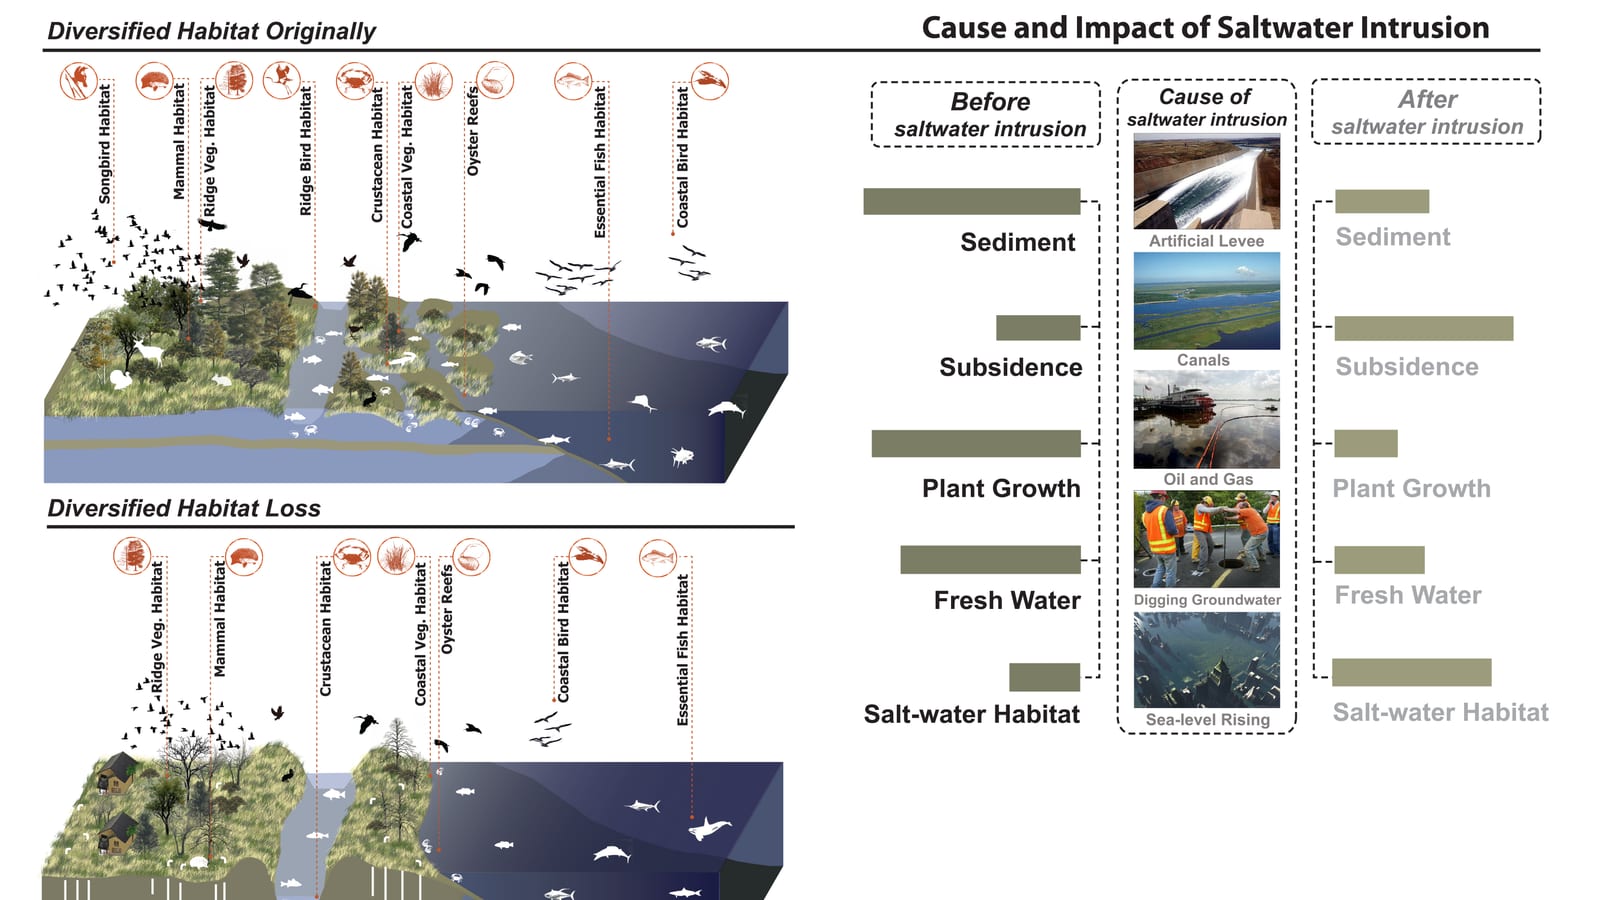
India's Coastal Aquifers Are Under Siege - Here's How Remote Sensing Is Fighting Back
A new piece from India Water Portal published this week puts a number to something many of us in the geospatial community have been watching quietly: saltwater intrusion is no longer a slow-creep background problem in India's coastal states, it is an active crisis. Gujarat, Tamil Nadu, Kerala, and Odisha are all experiencing aquifer salinisation at a pace that outstrips conventional monitoring. The timing matters because India's groundwater observation network was designed for quantity, not salinity. That gap is exactly where saltwater intrusion remote sensing steps in.
This article is not a literature review. It is a practical walkthrough of which tools work, why they work, and what the evidence from Indian coastal zones actually looks like.
Why Is Saltwater Intrusion So Hard to Detect Conventionally?
Saltwater intrusion (SWI) happens when the hydraulic head in a coastal aquifer drops, through over-extraction, reduced recharge, or sea-level rise, and the freshwater–saltwater interface migrates inland. The problem is inherently three-dimensional: the interface can be shallow in one well and 30 metres deeper 500 metres away, depending on lithology and pumping history.
Traditional monitoring relies on a network of observation wells with electrical conductivity sensors. In theory, this works. In practice, India's coastal well networks are sparse, unevenly maintained, and tell you what has already happened, not what is about to happen. As the SCI Publications review on SWI management notes, monitoring techniques range from hydrochemical sampling to geophysical surveys, but each method has spatial or temporal gaps that remote sensing can help fill.
What Remote Sensing Actually Measures (and What It Doesn't)
Let me be direct about the physics here, because this is where a lot of popular coverage gets fuzzy.
Satellites do not see groundwater directly. What remote sensing captures are surface and near-surface proxies that correlate with subsurface salinity conditions:
- Soil surface reflectance and salinity indices - Hyperspectral and multispectral sensors (Sentinel-2, Landsat-8/9) detect salt efflorescence on the soil surface. Bands in the SWIR region (1.5–2.5 µm) are particularly sensitive to salt-affected soils. This works well in Gujarat's Saurashtra coast, where seasonal drawdown exposes saline soil patches.
- Vegetation stress signatures - Halophyte encroachment and crop stress caused by root-zone salinity show up clearly in NDVI and red-edge indices. A study on Kerala's southwest coast (Springer, 2025) integrated biogeochemical and remote sensing data along a 650 km coastal stretch, the first time such a comprehensive spatial sweep had been attempted for the region, and found that vegetation anomalies tracked well with zones of submarine groundwater discharge.
- Land subsidence via InSAR - Differential interferometric SAR (Sentinel-1) detects millimetre-scale ground deformation. Aquifer compaction from over-extraction, a precursor to accelerated SWI, leaves a measurable subsidence signature.
- Thermal infrared - Groundwater discharge into coastal waters creates temperature anomalies detectable in Landsat Band 10 or MODIS thermal data. This is particularly useful for mapping submarine groundwater discharge zones.
What remote sensing cannot do alone is tell you the chloride concentration at 20 metres depth in a specific well. That still requires in-situ measurement. The power is in spatial extrapolation and early warning.
The EMI and Geophysical Layer: Bridging Surface and Subsurface
Electromagnetic induction (EMI) surveys, airborne or ground-based, measure apparent electrical conductivity of the subsurface. Saline water is far more conductive than freshwater, so EMI produces a direct proxy for the freshwater–saltwater interface depth. Research from southern India (ResearchGate, demarcating SWI pathways) demonstrated that combining EMI with remote sensing and GIS allowed researchers to map intrusion pathways controlled by geological structures, faults and fractures that act as conduits, rather than just the broad interface position.
This is an important nuance for Tamil Nadu and Kerala, where crystalline basement geology means SWI doesn't advance as a uniform front. It fingers inland along fracture zones. A satellite-only approach would miss this entirely; the integrated RS + geophysics workflow catches it.
A Worked Example: Gujarat's West Coast
Gujarat offers arguably the most data-rich Indian case for saltwater intrusion remote sensing. The AMS Journals study on remote sensing for groundwater in Gujarat showed that satellite-derived data could complement and spatially interpolate sparse well observations to improve groundwater storage estimates across the state. More recently, the India Water Portal piece cites a new Gujarat study integrating satellite imagery, IoT sensors, and predictive analytics to detect SWI before it reaches critical thresholds.
Here is how such a workflow typically looks in practice:
- Baseline mapping - Sentinel-2 composites (dry season) to map salt-affected soil extent using the Salinity Index (SI = √(Band3 × Band4)) and SWIR ratio.
- Change detection - Multi-year NDVI time series to identify vegetation decline corridors aligned with creek networks and tidal channels.
- Subsidence check - Sentinel-1 ascending and descending pass InSAR to flag areas of active compaction near major pumping centres.
- Ground truth integration - Electrical conductivity readings from IoT-enabled piezometers at ~15–20 representative wells, used to calibrate the spectral salinity indices.
- Predictive layer - Machine learning models (typically Random Forest or gradient boosting) trained on the above, with monsoon recharge and pumping rate as additional inputs, to forecast interface migration over the next season.
The output is a probability map of SWI risk, not a precise interface depth map, but actionable enough for district-level groundwater management decisions.
What the Minjur Case Tells Us About Tamil Nadu
The DTU study on Minjur, Tamil Nadu is worth reading carefully. Minjur sits north of Chennai, in a densely populated coastal zone with heavy groundwater dependency. The study investigates the spatial extent of salinisation and the hydrogeochemical processes driving it, and the findings reinforce a pattern I see repeated across Indian coastal zones: anthropogenic over-extraction is amplifying what would otherwise be a moderate natural SWI signal. Remote sensing here helps delineate the spatial footprint of salinisation, while hydrogeochemistry explains the mechanism. Neither alone is sufficient.
Where the Field Is Heading in India
The Stanford remote sensing SWI research and the MDPI global SWI review both point toward the same convergence: the most effective monitoring systems combine satellite data, geophysical surveys, and dense sensor networks, processed through machine learning pipelines. India is beginning to build this capacity - HARSAC's satellite-based agricultural stress monitoring in Haryana (The Better India) shows that state-level RS infrastructure can be operationalised at scale for 15 lakh farmers. Adapting similar architectures for coastal aquifer monitoring in Gujarat, Odisha, Kerala, and Tamil Nadu is technically feasible today.
The barrier is not the satellite data - Sentinel-1 and Sentinel-2 are free and globally available. The barrier is the calibration network: enough ground-truth salinity sensors to make the spectral proxies trustworthy at the local level. That is the investment India's coastal states need to prioritise.
Frequently asked questions
Can satellites directly measure groundwater salinity in coastal aquifers?
No, satellites cannot see groundwater directly or tell you chloride concentration at depth. They capture surface proxies like soil salinity, vegetation stress, subsidence, and thermal anomalies that correlate with subsurface salinity conditions.
Which Sentinel-2 spectral region is most sensitive to salt-affected soils?
The shortwave infrared (SWIR) region, between 1.5 and 2.5 micrometres, is particularly sensitive to detecting salt efflorescence on the soil surface, which works well along Gujarat's Saurashtra coast.
How does InSAR help flag saltwater intrusion risk before it worsens?
Differential InSAR from Sentinel-1 detects millimetre-scale ground deformation, and aquifer compaction caused by groundwater over-extraction leaves a measurable subsidence signature. Because this compaction is a precursor to accelerated saltwater intrusion, tracking it gives an early warning before the intrusion accelerates further.
Why doesn't saltwater intrusion advance as a uniform front in Tamil Nadu and Kerala?
Crystalline basement geology in these states means intrusion fingers inland along fracture zones rather than moving as a uniform front, so a satellite-only approach would miss these structurally controlled pathways.
References
- India Water Portal, How technology is helping India track saltwater intrusion in coastal aquifers
- SCI Publications, Management of Saltwater Intrusion in Coastal Aquifers: A Review
- MDPI, Global Investigations of Seawater Intrusion in Coastal Aquifers
- DTU Orbit, Extent of saltwater intrusion in coastal Minjur, India
- ResearchGate, Demarcating saline water intrusion pathways using remote sensing, GIS and geophysical techniques in Southern India
- Stanford Sustainability, Understanding saltwater intrusion through remote sensing
- Springer, Submarine groundwater discharge, Kerala coast, India
- AMS Journals, Using remote sensing data to improve groundwater supply estimations in Gujarat, India
- Taylor & Francis, Remote sensing and GIS for groundwater potential zones, Kerala
Researched and drafted with AI assistance.
Hero image: "Salt water intrusion wikipedia2" by Sweetian is licensed under CC BY-SA 3.0. To view a copy of this license, visit https://creativecommons.org/licenses/by-sa/3.0/.