SAR Coherence for Landslide Mapping: Sentinel-1 Methods Explained
SAR coherence change detection lets disaster managers map monsoon landslides in the Himalayas and Western Ghats even under total cloud cover. This article walks through the full Sentinel-1 SLC processing workflow in SNAP and explains where the method succeeds and fails in Indian terrain.
Why Clouds Can't Stop SAR Coherence Landslide Mapping
Every monsoon season, the Himalayas and Western Ghats become some of the most dangerous terrain on Earth. Rainfall-triggered landslides bury roads, villages, and people, often within minutes. The cruel irony is that the same clouds delivering that rain make optical satellite imagery nearly useless precisely when disaster response teams need it most. Landsat, Sentinel-2, and even high-resolution commercial sensors go blind under thick monsoon cloud cover.
This is where Synthetic Aperture Radar (SAR) coherence becomes operationally critical. SAR signals penetrate cloud cover and work day or night. For Indian disaster management agencies, from the National Disaster Management Authority (NDMA) to state-level response teams in Uttarakhand, Himachal Pradesh, and Kerala - SAR coherence landslide mapping is increasingly moving from research curiosity to frontline tool.
This article explains how the method works, how to implement it with freely available Sentinel-1 data, and what its real limitations look like in practice.
What Is SAR Coherence and Why Does It Reveal Landslides?
SAR coherence measures how similar two radar images of the same area are, taken at different times. Technically, it quantifies the phase correlation between two SAR acquisitions, a value between 0 (completely decorrelated) and 1 (perfectly coherent).
When the ground surface remains stable between two acquisition dates, the radar signal bounces back in a consistent, predictable way: high coherence. When a landslide occurs, displacing soil, uprooting vegetation, rearranging boulders, the surface geometry changes dramatically. The radar signal returns differently: coherence drops sharply toward zero.
This decorrelation is the landslide's fingerprint in SAR data.
It's worth distinguishing coherence from two related SAR techniques:
- SAR Intensity Change Detection: Compares the brightness of two images. Useful, but sensitive to soil moisture and vegetation changes unrelated to landslides.
- SAR Interferometry (InSAR): Uses phase differences to measure millimetre-scale surface displacement. Excellent for slow-moving landslides but requires stable phase, which breaks down in vegetated, rapidly changing terrain.
- SAR Coherence Change Detection (CCD): Uses the loss of coherence as the signal. More robust in vegetated terrain than intensity alone, and captures sudden, large-displacement events that InSAR cannot.
For monsoon-triggered landslides in the Himalayas and Western Ghats, which tend to be rapid, large, and occur under dense vegetation, coherence change detection is often the most reliable automated approach.
How to Process Sentinel-1 Coherence for Landslide Detection
Sentinel-1 (operated by ESA) provides free C-band SAR data with a 6-day repeat cycle for much of India when both Sentinel-1A and 1B are operational. Here is a practical processing workflow:
Step 1 - Data Selection
Download Sentinel-1 Ground Range Detected (GRD) or Single Look Complex (SLC) products from the Copernicus Open Access Hub. For coherence computation, you need SLC products. Select pairs with the shortest possible temporal baseline that bracket your event, ideally one image just before and one just after the suspected landslide.
Step 2 - Preprocessing in SNAP
ESA's free SNAP (Sentinel Application Platform) handles most of the heavy lifting:
- Apply orbit files (precise orbit determination improves geometric accuracy)
- Coregister the image pair, this aligns them sub-pixel to sub-pixel
- Compute coherence using the Interferogram Formation operator, which outputs both the interferometric phase and the coherence magnitude
- Apply terrain correction using a DEM (SRTM 30m or ALOS World 3D work well for Indian terrain)
A typical coherence window size of 10 × 2 pixels (range × azimuth) balances spatial resolution against statistical reliability. Larger windows produce smoother coherence estimates but blur small landslide boundaries.
Step 3 - Change Detection
Subtract or ratio the post-event coherence from a pre-event baseline coherence map. Areas where coherence drops significantly, typically below a threshold of around 0.3 to 0.4, though this must be calibrated locally, are candidate landslide zones.
Step 4 - Filtering and Validation
Apply a slope mask derived from your DEM to exclude flat areas (landslides don't initiate on flat terrain). Cross-reference with optical imagery from cloud-free windows, field reports, or the Landslide Atlas of India published by ISRO's National Remote Sensing Centre (NRSC), which provides a valuable ground-truth reference for Indian conditions.
A Worked Example: Distinguishing Landslide Signal from Vegetation Noise
Imagine you are processing a Sentinel-1 pair over a district in Uttarakhand, one image from late June, one from early July after a heavy rainfall event. Your coherence difference map shows several low-coherence patches.
The problem: monsoon rains also cause rapid vegetation growth and soil moisture changes, which independently decorrelate the SAR signal. How do you separate real landslides from "false positives"?
A practical multi-criteria filter helps:
- Slope threshold: Retain only pixels on slopes steeper than 25–30°
- Patch size: Landslides typically produce spatially contiguous low-coherence patches of at least a few thousand square metres, filter out isolated single pixels
- Shape elongation: Many landslides produce elongated, downslope-oriented patches; compute patch eccentricity
- Temporal consistency: If coherence was already low before the event (dense forest, persistent moisture), the change in coherence matters more than the absolute post-event value
None of these filters is perfect individually. Together, they substantially reduce false positives in practice, though validation against field data remains essential before any operational use.
Key Limitations to Understand Before Deploying This Method
SAR coherence landslide mapping is powerful but not infallible. Being honest about limitations matters especially in disaster contexts where false confidence can cost lives.
- Vegetation decorrelation: Dense forest in the Western Ghats produces naturally low coherence even without landslides. C-band SAR (Sentinel-1's frequency) is particularly sensitive to vegetation canopy changes. L-band sensors (like ALOS-2 PALSAR) penetrate vegetation better, but their data is not freely available at Sentinel-1's revisit frequency.
- Temporal baseline trade-off: A 6-day gap is short enough to limit seasonal decorrelation but may miss slow-onset events or capture too much non-landslide change during peak monsoon.
- Minimum mapping unit: Sentinel-1's spatial resolution (~10–20m in IW mode) means very small landslides are invisible. Many fatal landslides in narrow Himalayan valleys are smaller than this.
- Geometric distortions: Steep terrain causes radar foreshortening and layover, entire slopes can be geometrically distorted or missing from the image. Always check your study area against a SAR incidence angle map.
- No depth information: Coherence tells you where the surface changed, not how deep or how much material moved. Volume estimation requires additional data.
Where Indian Agencies Are Heading with This
ISRO's NRSC has been active in SAR-based landslide research and maintains the Landslide Atlas of India, which documents thousands of historical events, an invaluable calibration resource. NDMA's disaster risk reduction frameworks increasingly reference satellite-based monitoring, and the Bhuvan geoportal provides some SAR-derived products for Indian users.
The practical gap that remains is near-real-time operational pipelines, automated processing chains that can deliver a coherence change map within 24–48 hours of a Sentinel-1 acquisition. Research groups in IITs and NRSC are working toward this, and ESA's Copernicus Emergency Management Service (CEMS) already provides some rapid mapping for major events globally, including in India.
For students and early-career professionals: building competency in SNAP-based SAR processing, combined with Python scripting using snappy or pyrosar, positions you well for exactly this kind of operational role. The data is free, the tools are largely open-source, and the problem is genuinely unsolved at scale.
Frequently asked questions
What coherence drop typically indicates a landslide occurred?
Areas where coherence drops below roughly 0.3 to 0.4 between a pre- and post-event image pair are treated as candidate landslide zones, though this threshold needs local calibration for each study area.
How often does Sentinel-1 revisit a given area in India for landslide monitoring?
Sentinel-1 provides free C-band SAR data on a 6-day repeat cycle for much of India when both Sentinel-1A and Sentinel-1B satellites are operational, short enough to bracket sudden landslide events.
Why does SAR work for landslide mapping when optical satellites fail during monsoon?
SAR signals penetrate cloud cover and work day or night, unlike optical sensors such as Landsat and Sentinel-2, which go blind under the thick cloud cover that typically accompanies landslide-triggering monsoon rainfall.
What slope angle is used to filter out false positives in landslide coherence maps?
A practical filter retains only pixels on slopes steeper than 25 to 30 degrees, since landslides do not initiate on flat terrain, helping exclude non-landslide decorrelation from the results.
References
- ESA Copernicus Open Access Hub: https://scihub.copernicus.eu/
- ESA SNAP Toolbox: https://step.esa.int/main/toolboxes/snap/
- ISRO NRSC Landslide Atlas of India: https://www.nrsc.gov.in/
- NDMA India: https://ndma.gov.in/
- Copernicus Emergency Management Service: https://emergency.copernicus.eu/
- ISRO Bhuvan Geoportal: https://bhuvan.nrsc.gov.in/
Researched and drafted with AI assistance.
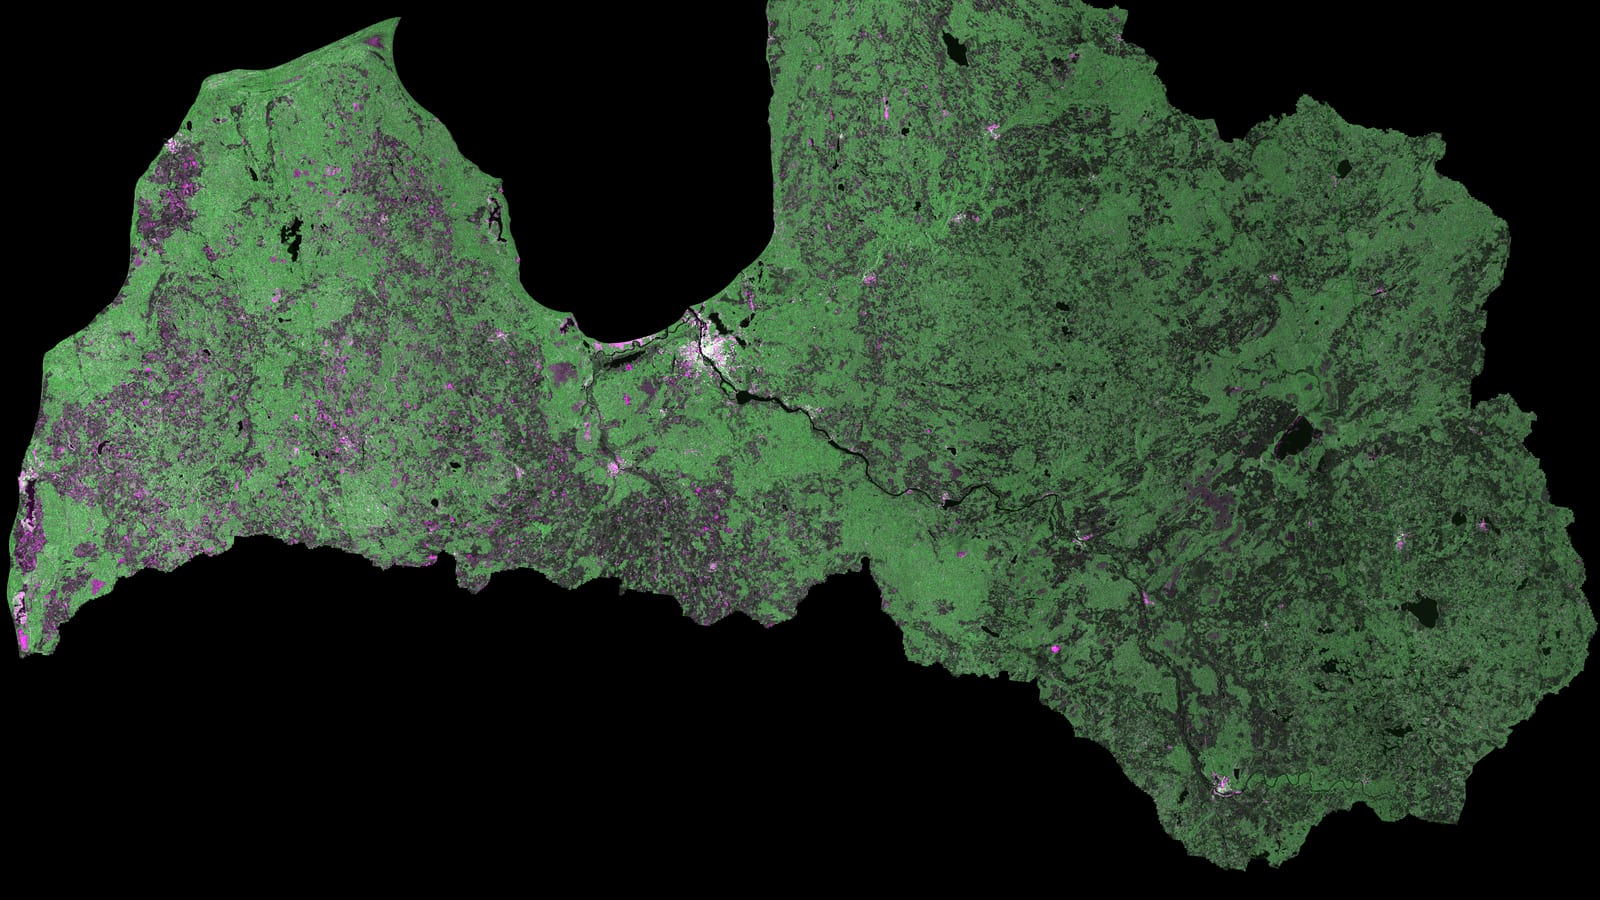
Hero image: "Latvijas teritorija Sentinel-1 SAR datu mozaīkā" by VoldemarsSkuja is licensed under CC BY-SA 4.0. To view a copy of this license, visit https://creativecommons.org/licenses/by-sa/4.0/.