Screen Jharia Mine Disturbance with Dynamic World
Use Dynamic World probabilities in Google Earth Engine to create a cautious, reviewable screen for bare-ground change around Jharia’s coal mines.
- Published
- Reading time
- 6 min
- Place
- Jharia Coalfield, Jharkhand, India
- By
- Jannat Khosla
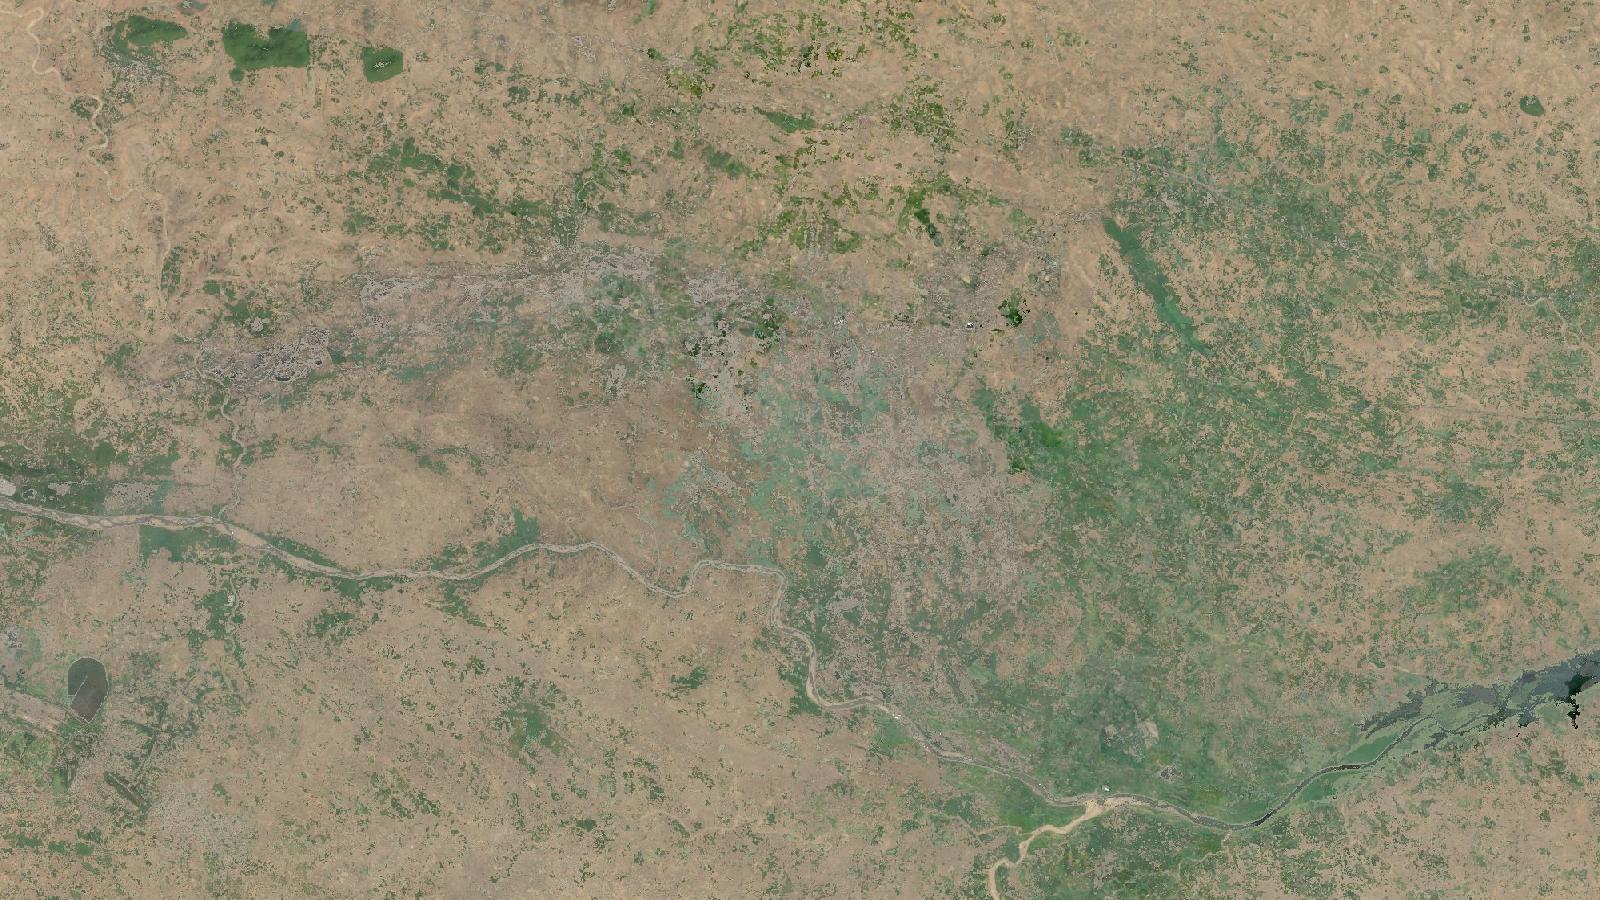
Cover: Landsat imagery of Jharia Coalfield, Jharkhand, India, NASA (public domain).
A first-pass screen for changing ground at Jharia
Jharia is a useful place to practise land-change screening because mining, settlements, vegetation, water and agriculture occur close together. The coalfield lies in Jharkhand’s Dhanbad and Bokaro districts, and a state report describes it as a major coal-producing area. Jharkhand’s environmental report places it between 23°38′ and 23°49′ N, and 86°09′ and 86°30′ E. The Government of Jharkhand also lists Jharia among the state’s coalfields. Government of Jharkhand
This is not a method for declaring that a new mine has opened, estimating production, or drawing a legal mine boundary. It is a practical way to make a review layer: locations where the likelihood of exposed ground has risen between two comparable periods. That distinction matters. A fresh overburden dump, dry soil, construction yard, road widening and a cloud-edge artefact can all look like change in a quick classification.
The input is Dynamic World V1 in Google Earth Engine. It supplies a land-cover label and per-class probabilities at 10 m for nine classes, derived from individual Sentinel-2 Level-1C scenes. The catalogue makes an important point that is easy to overlook: its predictions are available only for source scenes with reported cloud percentage at or below 35%, and clouds and shadows are masked. That is useful preprocessing, not a guarantee that every remaining pixel is suitable for interpretation. Dynamic World V1 catalogue
For Jharia, I prefer to work with the bare probability, rather than treating the label band as a mine map. The label simply identifies the class with the highest estimated probability. A pixel can win the bare label while the evidence is weak. The catalogue specifically recommends thresholding the highest predicted probability when selecting confident pixels, and warns that bright surfaces, sand and sunglint can be troublesome. That is exactly why probability is a better starting point for a change screen.
What the output can and cannot say
A 10 m pixel represents ground within that footprint; it does not trace a bench edge, vehicle track or parcel boundary. Sentinel-2’s multispectral instrument has four 10 m bands, six 20 m bands and three 60 m bands. ESA SNAP Sentinel-2 overview Dynamic World publishes its bands at 10 m, but that does not turn the result into a survey-grade mine plan.
Treat the result as a shortlist for visual inspection. An analyst can open the matching Sentinel-2 scene, compare it with another cloud-free date, check context in high-resolution imagery where licensing permits, and consult field or operator information. This sequence is much more defensible than colouring every bare pixel grey and reporting the total as mine expansion.
Season is another quiet source of error. Comparing a dry April window in one year with a wet August window in another can mostly measure seasonal ground condition. Choose equivalent calendar windows. In this example, April to May is used for both years. If your question concerns monsoon disturbance, use matched monsoon windows instead, and document that decision.
Worked example in Earth Engine
The following script creates two period composites of bare probability, masks each composite to pixels whose mean probability is at least 0.60, then finds places that meet that rule in the later period but not the earlier one. The small rectangle is deliberately only a demonstration area near Jharia. Replace it with a digitised study boundary before any real analysis.
// Demonstration area near Jharia Coalfield, Jharkhand.
var aoi = ee.Geometry.Rectangle([86.31, 23.70, 86.43, 23.80]);

var earlyStart = '2021-04-01';
var earlyEnd   = '2021-06-01';
var lateStart  = '2025-04-01';
var lateEnd    = '2025-06-01';

var dw = ee.ImageCollection('GOOGLE/DYNAMICWORLD/V1')
  .filterBounds(aoi);

function meanBare(start, end) {
  return dw.filterDate(start, end)
    .select('bare')
    .mean()
    .clip(aoi);
}

var earlyBare = meanBare(earlyStart, earlyEnd);
var lateBare = meanBare(lateStart, lateEnd);

var threshold = 0.60;
var earlyConfident = earlyBare.gte(threshold);
var lateConfident = lateBare.gte(threshold);
var newBare = lateConfident.and(earlyConfident.not()).selfMask();

Map.centerObject(aoi, 12);
Map.addLayer(earlyBare, {min: 0, max: 1, palette: ['ffffff', 'f0b000', '7a3b00']},
  'Early mean bare probability');
Map.addLayer(lateBare, {min: 0, max: 1, palette: ['ffffff', 'f0b000', '7a3b00']},
  'Late mean bare probability');
Map.addLayer(newBare, {palette: ['ff00ff']},
  'Review candidates, confident later bare only');
Start by inspecting the two probability layers before looking at the magenta result. A location with a late mean of 0.61 and an early mean of 0.59 technically crosses the selected rule, yet it is a weak change signal. In contrast, a coherent patch that changes from low probability to a visibly high later probability deserves attention. Use the candidate layer to direct the review, never to replace it.
I would also display the Dynamic World labels and source imagery while checking candidates. Each Dynamic World image corresponds to an individual Sentinel-2 Level-1C asset, which makes scene-level checking possible through the matching collection names. The imagery is top-of-atmosphere reflectance in Level-1C, while Level-2A is bottom-of-atmosphere reflectance. ESA product-level description
Calculate area without changing the analysis scale
A useful second output is the area of candidate pixels, labelled honestly as “screened new confident-bare area”. It is not “new mining area”. The difference protects both the analysis and the people who may use it.
var candidateHa = newBare
  .multiply(ee.Image.pixelArea())
  .divide(10000)
  .rename('hectares');

var result = candidateHa.reduceRegion({
  reducer: ee.Reducer.sum(),
  geometry: aoi,
  scale: 10,
  maxPixels: 1e9
});

print('Screened new confident-bare area, hectares', result);
The scale: 10 line is not decorative. Earth Engine recommends specifying a scale, or a CRS and transform, for reduceRegion() because complex processing can otherwise leave the output scale ambiguous. Its documentation also explains that increasing scale or using bestEffort can make a reduction succeed, but that means a coarser computation may have been used. Earth Engine regional statistics guide
For a comparable time series, retain the same AOI, dates by season, threshold, scale and handling of masked pixels. Put those settings into a small metadata table alongside every exported result. If a candidate is later rejected after image review, record why: seasonal bare farmland, road work, shadow, water-edge change, or another reason. Those notes expose the limits of the method and make the next review faster.
The beginner mistake that changes the conclusion
The common mistake is to calculate an area after setting bestEffort: true, then quote it as if it came from 10 m data. bestEffort permits Earth Engine to choose a larger scale when the requested operation exceeds the pixel limit. That can be appropriate for exploratory work, but it breaks a claim that the result is a 10 m area calculation.
Instead, begin with a compact AOI and specify scale: 10. Set a suitable maxPixels value only after you know the requested scale is deliberate. For a large study boundary, split the calculation into meaningful units such as leases, wards or a regular grid, while retaining the same scale. Do not quietly coarsen the analysis merely to remove an error message.
This workflow is strongest when it is used as triage. Dynamic World makes it quick to find plausible change, while the analyst supplies the date matching, threshold rationale, local knowledge and evidence needed before calling the change mining.
Frequently asked questions
Does a bare Dynamic World pixel mean coal mining?
No. It means bare was the model’s highest-probability land-cover interpretation, or had a specified probability in this workflow. Exposed soil, spoil, construction areas and roads may produce similar signals, so confirm every candidate with imagery and local context before assigning a cause.
Why use the probability band instead of the label band?
The probability band shows how strongly the model supported bare, whereas the label only identifies the highest-ranked class. Thresholding probability lets you discard weak, ambiguous pixels and compare the strength of evidence across dates rather than accepting every winning class label.
Can I use this result to calculate mine expansion?
No, not without independent validation and a definition of what counts as mining. The output measures screened change in confidently bare pixels under chosen rules. It can support a review programme, but it does not separate mining disturbance from all other exposed-ground changes.
What date windows should I compare in Jharia?
Use matching seasonal windows in each year, such as April to May compared with April to May. This reduces the chance that crop cycles, rainfall and short-lived wetness are driving the difference. Inspect scene availability and masks before fixing the final comparison dates.
References
- Dynamic World V1, Google Earth Engine Data Catalog
- Statistics of an Image Region, Google Earth Engine
- Sentinel-2 overview, ESA SNAP documentation
- Jharkhand environmental report on the Jharia Coalfield
- Minerals, Government of Jharkhand
Cover image: Landsat true-colour composite of Jharia Coalfield, Dhanbad (2000), NASA/USGS Landsat WELD via NASA GIBS (public domain).
Researched and drafted with AI assistance; sources are linked for verification.
Need this done for your own study area? Send me the area and what you need.
Cite this post
Khosla, J. (2026, November 16). Screen Jharia Mine Disturbance with Dynamic World. Jannat Khosla. https://jannatkhosla.com/blog/screen-jharia-mine-disturbance-with-dynamic-world
› BibTeX
@online{khosla2026screen,
  author = {Khosla, Jannat},
  title = {Screen Jharia Mine Disturbance with Dynamic World},
  date = {2026-11-16},
  url = {https://jannatkhosla.com/blog/screen-jharia-mine-disturbance-with-dynamic-world}
}