Screen Brick Kilns Around Delhi in QGIS with Sentinel-2
A practical QGIS method for finding and recording likely brick-kiln sites on Delhi’s outskirts with dry-season Sentinel-2 imagery, while keeping false confidence out of the result.
- Published
- Reading time
- 7 min
- Place
- Delhi NCR and the Yamuna-Hindon floodplain, India
- By
- Jannat Khosla
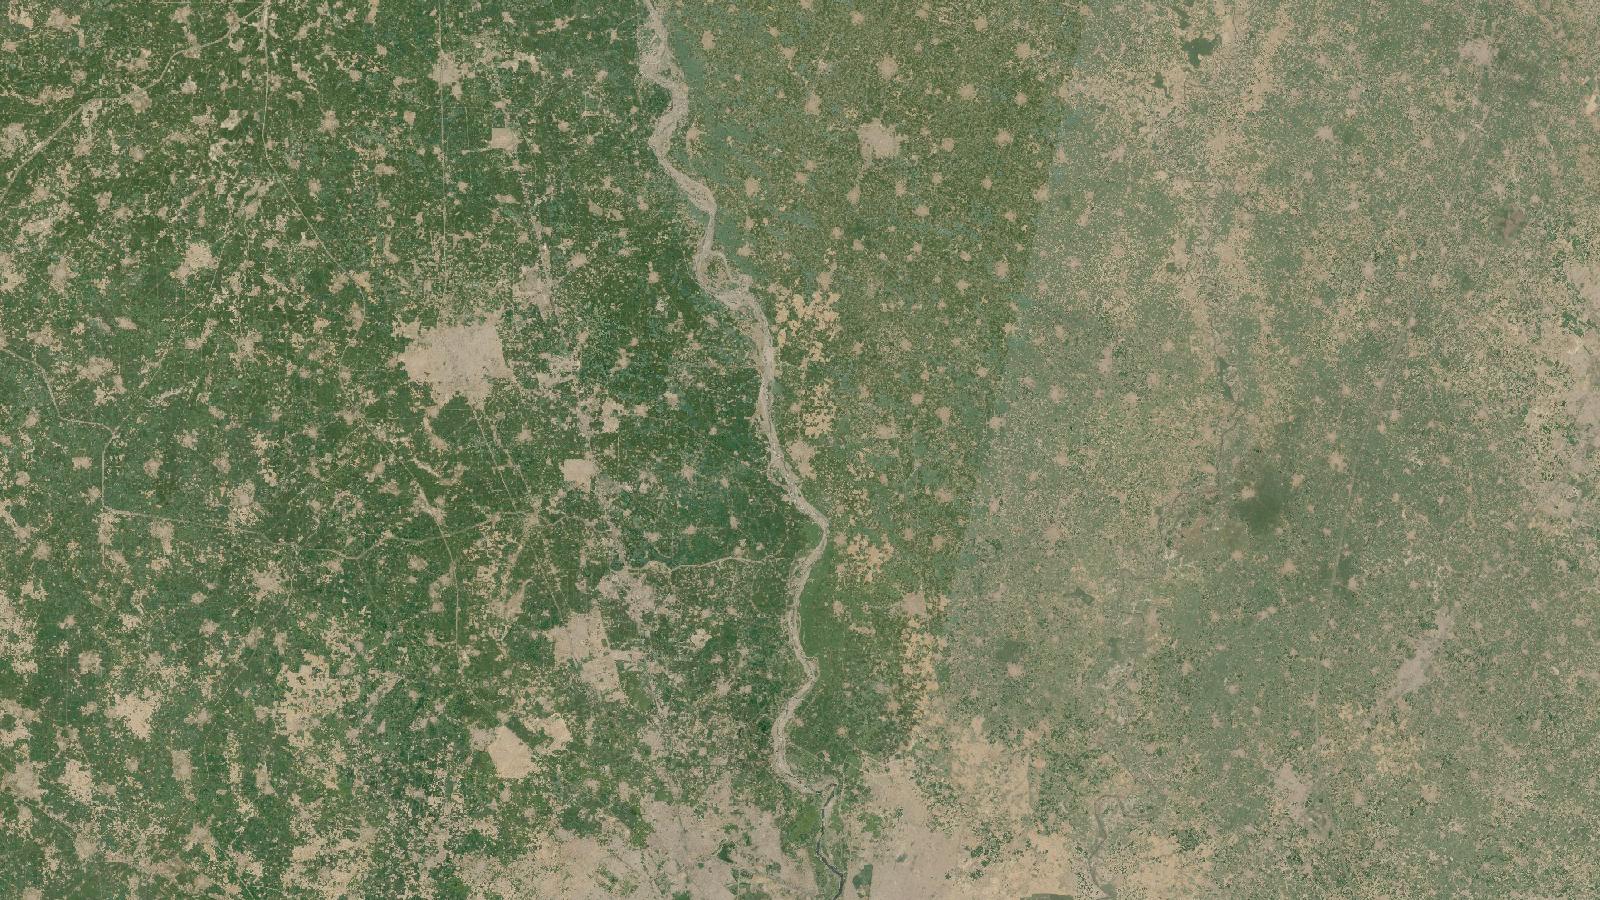
Cover: Landsat imagery of Delhi NCR and the Yamuna-Hindon floodplain, India, NASA (public domain).
A screening map, not an enforcement map
Brick kilns are an awkward target for a GIS workflow. They matter to air-quality and land-use work, yet they can be seasonal, change form, and sit among bare soil, construction plots and peri-urban settlement. Around Delhi, that ambiguity is part of the problem, not a minor clean-up task.
Sentinel-2 is useful here because it is free, regularly acquired and covers a wide area. Its Multispectral Instrument has 13 bands, with visible and near-infrared bands at 10 m, red-edge and shortwave-infrared bands at 20 m, and atmospheric bands at 60 m. That resolution can reveal the pattern of a larger kiln site, but it cannot reliably resolve every stack, brick row or operating detail. ESA’s Sentinel-2 facts and figures
The right output is therefore a candidate inventory. Each point should mean “site requiring review”, rather than “active kiln”, “unauthorised kiln” or a precise technology classification. That distinction protects the analysis when it is passed to an air-quality team, a field crew or a client.
Why focus on the Delhi fringe
The Yamuna and Hindon floodplains and the outward-growing settlements around Delhi form a sensible study setting. A published Sentinel-2 study of the Delhi periphery describes the area as alluvial floodplain with a mix of rural, suburban and agricultural land, alongside rapid construction in Delhi’s surrounding cities. It also notes that kilns tend to occur outside urban areas near expanding built-up land. Misra et al., 2020
This does not mean every brown oval near a road is a kiln. It means the landscape supplies useful context for deciding where to look first. A candidate becomes more credible when several clues agree: an oval or circular production layout, a disturbed and reddish yard, a chimney shadow in a suitably timed optical scene, and a location on the peri-urban edge rather than inside a dense industrial estate.
The policy context makes careful location records useful. A 2025 CPCB direction says kiln notice boards should display details including the kiln’s coordinates, design type, soil-mining location and stack-monitoring date. The same document refers to standards and conversion requirements set through earlier notifications. A satellite point cannot prove any of those details, but it can provide a transparent list for comparison with records or field checks. CPCB direction, 23 April 2025
Prepare a dry-season image set
For this workflow, use several low-cloud Sentinel-2 Level-2A scenes from the dry operating period, rather than trusting a single attractive image. The Delhi study used cloud-masked, median-composited imagery acquired between January and June 2018, explaining that kilns operate in the dry months and may be grass-covered during seasonal suspension. Misra et al., 2020
Download scenes covering a manageable corridor, for example the Delhi, Ghaziabad, Loni and Baghpat fringe. Keep the acquisition date in each layer name. Load the 10 m B2, B3, B4 and B8 bands into QGIS, then add B11 and B12 only when you need the shortwave-infrared context. B11 and B12 are 20 m data, so resample them deliberately if you display them with 10 m bands. Resampling improves alignment for viewing; it does not create 10 m information.
Start with two displays:
- a natural-colour view using B4, B3 and B2;
- a false-colour view using B12, B8 and B4, with contrast stretched separately for each scene.
Do not copy display minimum and maximum values blindly across dates. Different haze, crop condition and scene processing can make a fixed stretch hide useful shapes or manufacture apparent change. Save a QGIS project with the scene dates visible in the layer panel so another analyst can repeat the inspection.
Build the candidate layer
Create a GeoPackage point layer named kiln_candidates. Use a projected CRS appropriate to the study area for distance and area work. Add fields for site_id, scene_date, confidence, evidence, review_date, reviewer and status. Make status start as candidate, not confirmed.
Work systematically. Create a fishnet over the study corridor, select one grid cell at a time, and inspect it at a consistent map scale. This is slower than panning until something looks interesting, but it makes omissions easier to explain. At every likely site, add one point at the centre of the apparent kiln complex and describe what you saw in evidence, such as “oval ring, bare yard, shadow, visible in two scenes”.
Then turn on a current high-resolution reference basemap where your organisation’s terms permit it. Check whether the candidate has a recognisable kiln layout rather than a circular road, soil stockpile, sports ground or housing construction. Record the reference imagery date if it is shown. A reference image acquired years away from the Sentinel-2 date is evidence of a location, not proof of activity on the satellite date.
The value of recording uncertainty is substantial. In the Delhi research, a combined Sentinel-2 method achieved precision of 0.99 but recall of 0.72, and the authors explicitly interpreted that recall as under-detection. The study detected 1,564 kilns in its study area. Misra et al., 2020
For a manual screening map, do not borrow those accuracy values as your own. They came from a particular labelled dataset, method and area. Instead, take a random sample from your high, medium and low confidence points, have a second reviewer inspect them without seeing your labels, and report agreement separately. If field access exists, use it to check both apparent hits and apparently empty grid cells.
Use NDVI as supporting evidence
NDVI can help distinguish persistent vegetation from a disturbed site, but it should never be the kiln detector by itself. In QGIS Raster Calculator, use:
("B8@1" - "B4@1") / ("B8@1" + "B4@1")
Substitute the names of your loaded near-infrared and red raster layers. QGIS Raster Calculator performs calculations using the values of loaded raster bands and writes the result as a new raster. QGIS Raster Calculator documentation
Sample the NDVI at each candidate across several dry-season dates. A sudden, persistent reduction can be a useful prompt to inspect a site more closely. It cannot prove kiln operation. The Delhi study found that a sustained NDVI shift could help infer the duration of land conversion, while also warning that annual operation timing cannot be derived accurately from NDVI trends alone. Misra et al., 2020
This is also a good place to retain the original values and dates. A graph that jumps because different pixels were sampled, clouds were missed or band grids were misaligned is not evidence of site change.
The beginner mistake that inflates the map
The common mistake is treating a 10 m pixel pattern as an individual facility diagnosis. A kiln can occupy only a handful of Sentinel-2 pixels in one dimension, while bare brick-earth, excavation and construction sites may look similar. The Delhi study states that unaided kiln identification is difficult at Sentinel-2’s relatively coarse scale and that its method could not distinguish kiln types. Misra et al., 2020
Avoid this by separating detection from verification. The first pass should produce candidates with evidence notes. The second pass uses another date and a higher-resolution reference. Only after a documented review should a point become confirmed visually; reserve field confirmed for an actual site check or an authoritative record match. Do not infer zig-zag compliance from the apparent site shape.
A useful deliverable is a map with candidate points symbolised by confidence, a grid showing where inspection was completed, and a table that states the imagery dates, visual cues, reviewer and verification limit. It is more defensible than a clean-looking layer of supposedly certain kilns.
Frequently asked questions
Can Sentinel-2 confirm that a brick kiln is operating?
No, Sentinel-2 can identify plausible kiln sites and sometimes reveal land-cover change, but it cannot confirm operating status on its own. Seasonal closure, vegetation cover and the sensor’s spatial resolution mean that current activity needs dated reference imagery, field observation or regulatory information.
Which Sentinel-2 bands should I load in QGIS?
Load B2, B3, B4 and B8 first because they are 10 m bands suitable for visual inspection and NDVI. Add B11 and B12 when shortwave-infrared context helps, while remembering that those bands are 20 m and must not be interpreted as native 10 m detail.
Should I count every candidate point as a kiln?
No, report candidates and confirmed sites as separate totals. A candidate list is a screening product, whereas a confirmed inventory requires an explicit review rule and ideally independent validation. Mixing both categories makes the final count look more certain than the evidence permits.
Can this workflow identify zig-zag kilns?
No, it should not be used to assign kiln technology from Sentinel-2 alone. The Delhi Sentinel-2 study reported that its method could not distinguish kiln types at this resolution. Use authoritative records, field checks or suitably detailed imagery for that question.
References
- European Space Agency, Sentinel-2 facts and figures
- Misra, Takeuchi and colleagues, Mapping Brick Kilns to Support Environmental Impact Studies around Delhi Using Sentinel-2
- Central Pollution Control Board, directions concerning brick-kiln notice boards
- QGIS documentation, Raster Calculator
Researched and drafted with AI assistance; sources are linked for verification.
Need this done for your own study area? Send me the area and what you need.
Cite this post
Khosla, J. (2026, November 13). Screen Brick Kilns Around Delhi in QGIS with Sentinel-2. Jannat Khosla. https://jannatkhosla.com/blog/screen-brick-kilns-around-delhi-in-qgis-with-sentinel-2
› BibTeX
@online{khosla2026screen,
  author = {Khosla, Jannat},
  title = {Screen Brick Kilns Around Delhi in QGIS with Sentinel-2},
  date = {2026-11-13},
  url = {https://jannatkhosla.com/blog/screen-brick-kilns-around-delhi-in-qgis-with-sentinel-2}
}