SUHI vs RUHI: Separating Surface and Air Temperature in UHI Studies
SUHI measures radiative skin temperature from satellites; conventional UHI measures screen-level air temperature. Conflating the two leads to flawed mitigation policy in Indian cities where ground-truth met data is scarce.
Why This Distinction Keeps Getting Blurred
Open almost any recent urban climate study from an Indian city and you will find LST maps derived from Landsat or MODIS presented alongside conclusions about how residents feel the heat. The leap from satellite-derived land surface temperature to lived thermal experience is rarely questioned. It should be.
The conflation of surface urban heat island vs urban heat island, specifically, the Surface Urban Heat Island (SUHI) and the conventional air-temperature Urban Heat Island (UHI, sometimes called RUHI for Rural–Urban Heat Island when the rural baseline is explicit), is one of the most persistent methodological slippages in applied urban climate work. In the Indian context, where mitigation policy is increasingly data-driven and where satellite data is often the only affordable option at scale, getting this distinction wrong has real consequences for how cities plan green roofs, tree cover targets, and cool-pavement programmes.
What Exactly Are We Measuring?
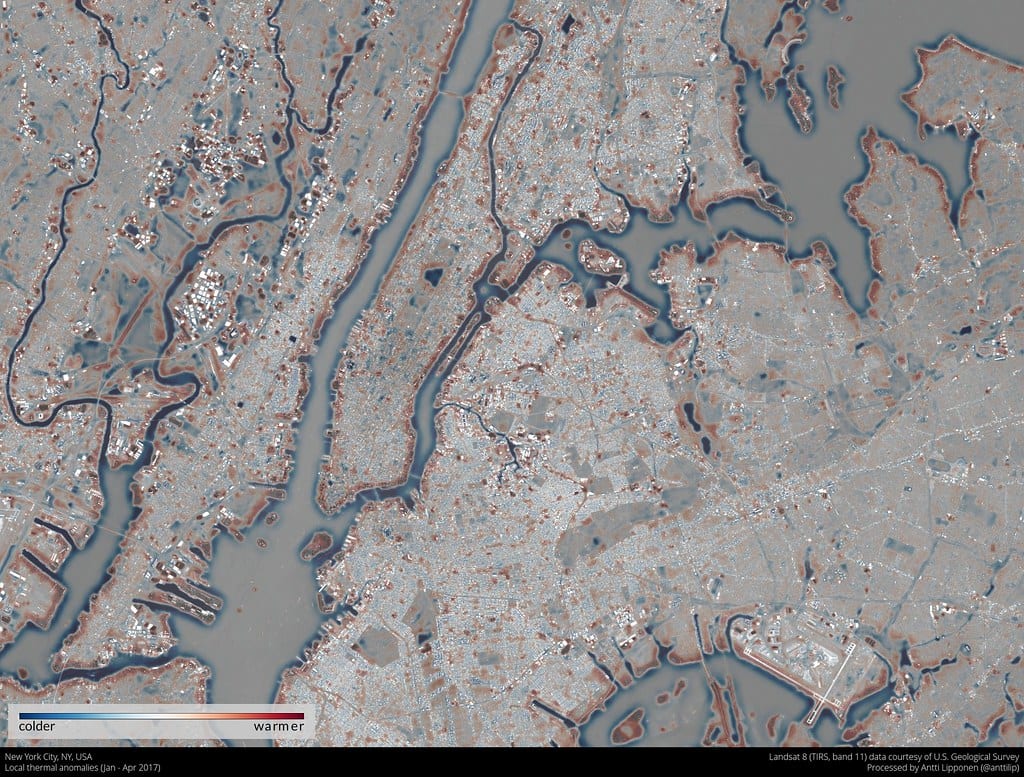
Illustrative: Landsat thermal infrared city mosaic. "NYC local thermal anomalies Jan-Apr 2017" by anttilipponen is licensed under CC BY 2.0. To view a copy of this license, visit https://creativecommons.org/licenses/by/2.0/.
Surface UHI (SUHI) is derived from thermal infrared remote sensing. Sensors aboard Landsat 8/9 (Band 10), MODIS (MOD11A), and Sentinel-3 SLSTR measure the radiometric temperature of the land surface, the skin temperature of roads, rooftops, soil, and vegetation canopies. This is a radiative quantity. It tells you how much longwave radiation a surface is emitting, not what the air above it feels like.
Air-temperature UHI is measured by meteorological stations, weather buoys, or traverses with calibrated thermometers at roughly 1.5–2 m above ground, the standard screen-level height. This is what the human body, building HVAC systems, and epidemiological heat-stress models actually respond to.
The two quantities are physically related but not interchangeable:
- LST can exceed air temperature by 10–15 °C or more over dry, impervious surfaces on a clear summer afternoon, because surfaces absorb solar radiation and re-emit it before the boundary layer has time to mix.
- At night, the relationship often reverses or narrows significantly, especially over vegetated urban parks.
- Cloud cover, wind speed, and surface moisture all modulate the LST–air temperature coupling in ways that vary by season, time of day, and city morphology.
Why Indian Cities Make This Especially Tricky
India's tier-1 and tier-2 cities span a remarkable range of climates, semi-arid Jaipur, humid-subtropical Kolkata, tropical-wet Chennai, and high-altitude Pune all behave differently. A few city-specific complications worth noting:
-
Monsoon seasonality: During the June–September monsoon, latent heat flux dominates energy partitioning. Wet surfaces cool rapidly, compressing SUHI intensity even as air temperatures remain high due to humidity. An analyst who only looks at summer LST composites will overstate the annual SUHI and potentially misattribute its cause.
-
Mixed land use: Indian cities often have dense informal settlements interspersed with industrial zones and green corridors. A single Landsat pixel (30 m) can contain multiple surface types, making emissivity correction, already the largest source of LST uncertainty, even harder.
-
Sparse met-station networks: Many tier-2 cities have one or two India Meteorological Department (IMD) stations, often located at airports away from the urban core. This makes it difficult to validate SUHI against measured air-temperature UHI, so the two get used as proxies for each other by default rather than by design.
A Worked Example: Interpreting a "Cool Roof" Intervention
Suppose a municipal corporation in a tier-2 city paints 500 rooftops white and commissions a before-after SUHI study using Landsat imagery. The results show a statistically significant 3–4 °C reduction in daytime LST over treated rooftops. The report concludes that the intervention "reduced urban heat."
Is that conclusion defensible? Partially, but carefully:
- The SUHI reduction is real and measurable. Reflective roofs reduce absorbed solar radiation, lowering surface temperature. This is exactly what LST captures.
- The air-temperature UHI effect is much smaller and harder to attribute. The sensible heat flux from 500 rooftops is a tiny fraction of the city's total energy budget. Boundary-layer air temperature may change by a fraction of a degree, and only under specific wind and mixing conditions.
- Thermal comfort for residents inside those buildings depends on roof U-values, indoor ventilation, and occupancy patterns, none of which LST addresses.
- Nighttime LST may tell a different story: cool roofs with low thermal mass can actually re-radiate less heat at night, which might reduce the nighttime UHI slightly, but this effect is often not reported because daytime imagery is more dramatic.
The honest summary: the intervention reduced SUHI (a radiative surface metric) during the day. Whether it meaningfully reduced the air-temperature UHI or improved thermal comfort requires additional data, ideally, collocated air-temperature loggers and indoor temperature monitoring.
How to Report Both Rigorously
If you are writing a study or a consultant's report, here is a minimum checklist for keeping SUHI and air-temperature UHI distinct:
- State your observable explicitly: "We analyse LST-derived SUHI" or "We analyse screen-level air-temperature UHI", not just "urban heat island."
- Report the time of overpass: Landsat crosses most Indian cities around 10:30 AM local time. Daytime SUHI intensity is not comparable to nighttime SUHI intensity, and neither maps cleanly onto 24-hour mean air temperature.
- Acknowledge emissivity assumptions: LST retrieval requires surface emissivity inputs. Errors of 0.01 in emissivity propagate to roughly 0.5 °C in LST. For mixed urban pixels, this uncertainty is non-trivial.
- Avoid causal language that crosses the boundary: Phrases like "LST shows residents experience X °C more heat" conflate the two metrics. Instead: "LST is elevated by X °C, which is consistent with higher sensible heat flux and likely contributes to elevated near-surface air temperatures, though direct measurement is needed to quantify the air-temperature effect."
- Use SUHI for what it is good at: Spatial mapping of heat hotspots, land-cover change analysis, green infrastructure planning at the neighbourhood scale. These are genuine strengths of the satellite approach.
- Use air-temperature UHI for what it is good at: Health impact assessment, HVAC load modelling, epidemiological heat-stress studies, and validating urban climate model outputs.
The Practical Takeaway for Indian Urban Climate Work
The surface urban heat island vs urban heat island distinction is not academic pedantry. It determines whether a mitigation measure is being evaluated against the right outcome. A city that plants trees to reduce air-temperature UHI but evaluates success only through SUHI maps may miss the fact that tree canopies actually lower LST (by shading and evapotranspiration) while also lowering air temperature, but the magnitudes and spatial extents of those two effects are different, and conflating them will produce inflated benefit estimates.
Conversely, a cool-pavement programme evaluated only through air-temperature sensors at a single met station will likely show no detectable signal, even if the SUHI reduction across treated streets is genuine and meaningful for pedestrian thermal comfort.
The path forward for Indian cities is hybrid: use satellite SUHI mapping for spatial prioritisation and monitoring at scale, deploy low-cost air-temperature sensor networks (increasingly feasible with IoT platforms) for ground-truth and health-outcome linkage, and be explicit in every report about which metric is being used and why.
Getting the vocabulary right is the first step toward getting the policy right.
Frequently asked questions
What is the difference between SUHI and air-temperature UHI?
SUHI is the radiometric skin temperature of surfaces measured by thermal satellites like Landsat, while air-temperature UHI is measured by weather stations at screen level and reflects what people actually feel.
How much higher can land surface temperature be than air temperature in Indian cities?
LST can exceed air temperature by 10-15°C or more over dry, impervious surfaces on a clear summer afternoon, because such surfaces absorb solar radiation and re-emit it before the air has time to mix.
Does painting rooftops white reduce the air-temperature urban heat island?
Cool roofs measurably reduce surface (SUHI) temperature, but the air-temperature UHI effect is much smaller and harder to attribute: in one cited example, the sensible heat flux from 500 rooftops was a tiny fraction of the city's total energy budget.
Why is validating SUHI against air-temperature UHI difficult in India's tier-2 cities?
Many tier-2 Indian cities have only one or two IMD weather stations, often located at airports away from the urban core, making it hard to validate satellite-derived SUHI against actual air-temperature UHI.
References
No specific external sources were cited in the research brief provided for this article. The physical principles and methodological considerations described here are grounded in standard urban climatology literature and remote sensing practice. Readers are encouraged to consult:
- Stewart, I. D., & Oke, T. R. (2012). Local Climate Zones for Urban Ecosystem Studies. Bulletin of the American Meteorological Society. https://doi.org/10.1175/BAMS-D-11-00019.1
- Voogt, J. A., & Oke, T. R. (2003). Thermal remote sensing of urban climates. Remote Sensing of Environment. https://doi.org/10.1016/S0034-4257(03)00079-8
- India Meteorological Department urban climate resources: https://www.imd.gov.in
- USGS Landsat Collection 2 LST product documentation: https://www.usgs.gov/landsat-missions/landsat-collection-2-surface-temperature
Researched and drafted with AI assistance.
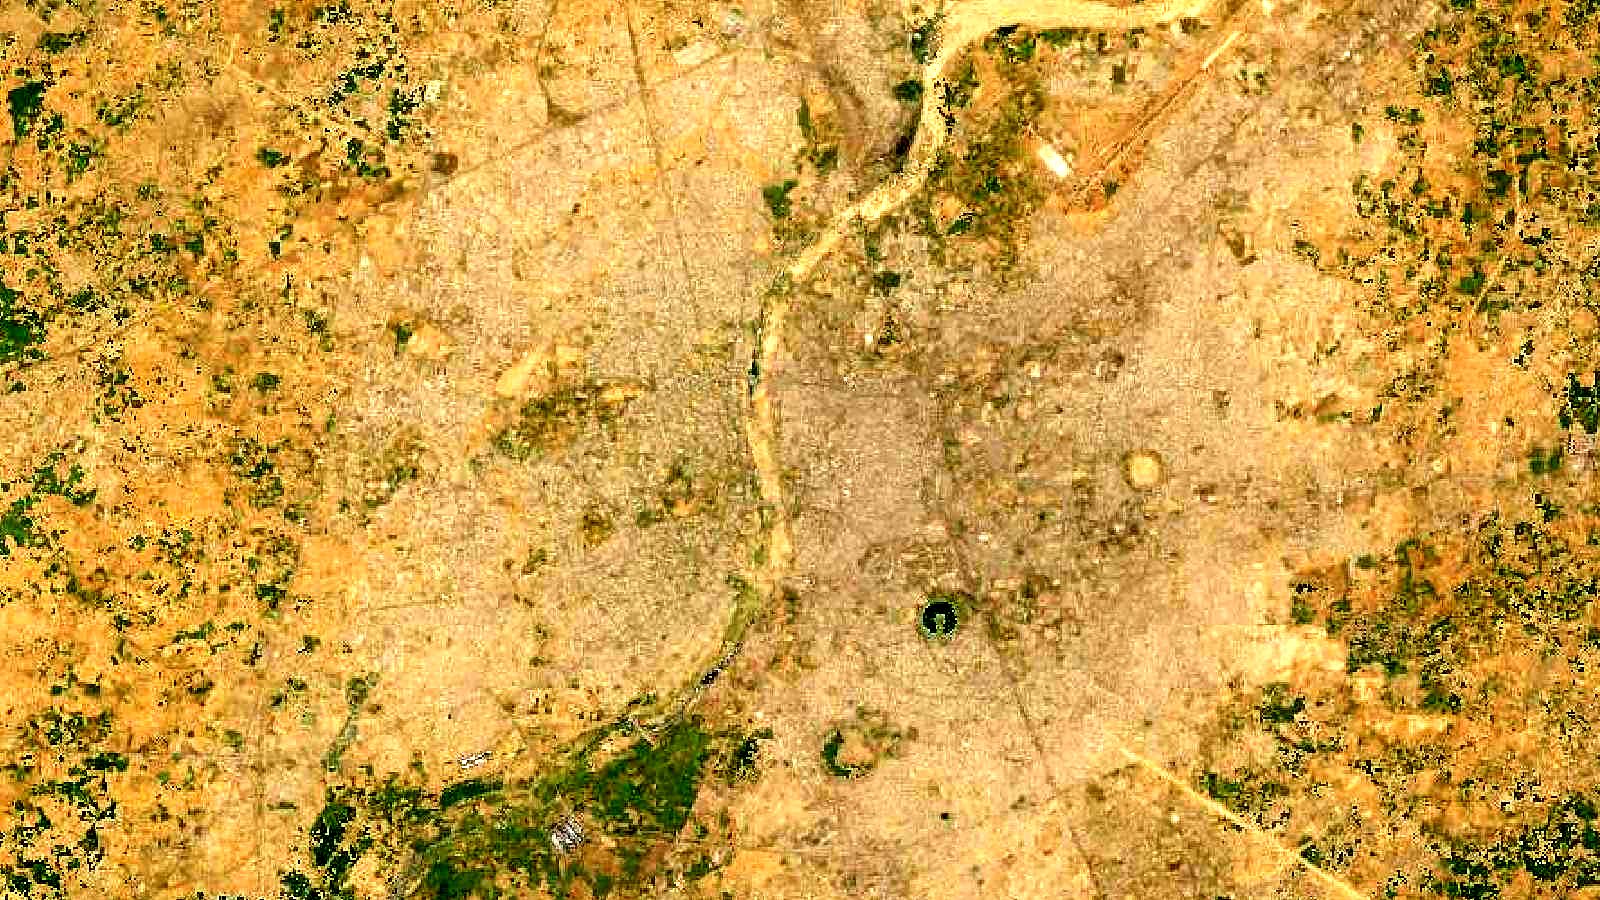
Cover image: Landsat true-colour composite of Ahmedabad and the Sabarmati, Gujarat (2000), NASA/USGS Landsat WELD via NASA GIBS (public domain).