Mapping Urban Heat Islands with Landsat LST in Google Earth Engine
A practical GEE workflow for mapping urban heat islands using Landsat 8 LST in Delhi NCR, covering NDVI-based emissivity estimation, Band 10 brightness temperature conversion, and the full LST retrieval formula.
On 13 June 2026, Delhi's Palam Airport recorded winds of 120 km/h, the strongest in over two decades, as western disturbance storms battered the capital just weeks before the monsoon's expected arrival (The Eastern Herald). The dramatic weather event is a reminder that Delhi NCR sits at the intersection of multiple climate stressors: rapid urbanisation, extreme heat, and increasingly volatile pre-monsoon conditions. For GIS and remote sensing practitioners, it is also a prompt. If you work in urban planning, disaster risk, or climate adaptation in India, knowing how to map land surface temperature (LST) and urban heat islands (UHI) using Landsat data in Google Earth Engine is no longer a nice-to-have skill, it is an operational one.
This article walks through the conceptual and practical workflow for urban heat island mapping with Landsat LST in GEE, with Delhi NCR as the working context.
Why LST, and Why Landsat?
Air temperature measurements from weather stations like Palam give us point data. They tell us that it is hot; they do not tell us where it is hottest, or why. Land surface temperature derived from satellite thermal infrared imagery fills that gap. LST captures the radiometric temperature of the Earth's surface, rooftops, roads, bare soil, vegetation, and because it varies sharply with land cover type, it is a direct proxy for the urban heat island effect.
Landsat's thermal infrared sensor (TIRS) has been the workhorse for this kind of analysis. The ISPRS-published GEE web-app study confirms that Landsat-5 and Landsat-8 thermal infrared bands, available at 30 m spatial resolution, are the standard input for UHI and LST studies (ISPRS Archives, 2021). That 30 m resolution is fine enough to distinguish a dense commercial block from a nearby park, which is exactly the granularity urban planners need.
Landsat-8 and Landsat-9 carry Band 10 (10.6–11.19 µm) as the primary thermal channel. The processing chain, from raw thermal band to calibrated LST, involves deriving top-of-atmosphere brightness temperature, estimating land surface emissivity from vegetation indices, and applying a radiative transfer correction. A peer-reviewed workflow published in the Journal of Geography confirms this sequence: thermal bands and soil emissivity are derived from Landsat-8 images and subsequently transformed into LST (Citeus UM, 2021).
Setting Up the GEE Workflow for Delhi NCR
Google Earth Engine makes what used to be a multi-day desktop processing task achievable in an afternoon. Here is a condensed version of the workflow I use for Delhi NCR studies:
1. Define your Area of Interest (AOI) Draw or import a polygon covering the Delhi NCR boundary. Using administrative boundaries from the GADM dataset keeps things reproducible.
2. Filter the Landsat image collection Filter Landsat 8 Surface Reflectance (Collection 2, Tier 1) by your AOI, a date range (April–June for peak pre-monsoon heat), and cloud cover below 10%. A script performing LST analysis over a specified AOI using Landsat 8 Surface Reflectance products follows exactly this filtering approach (AGSRT, 2023).
3. Compute NDVI and emissivity Calculate the Normalised Difference Vegetation Index (NDVI) from Bands 4 and 5. From NDVI, estimate the proportion of vegetation cover (Pv), and from Pv, derive land surface emissivity (ε). Emissivity accounts for the fact that different surfaces radiate heat differently, asphalt emits more efficiently than a water body, which matters for accurate LST retrieval.
4. Convert Band 10 to brightness temperature Apply the standard Landsat thermal conversion constants to convert the raw digital number in Band 10 to at-sensor brightness temperature (in Kelvin), then to Celsius.
5. Apply the LST formula The final LST is calculated as:
LST = BT / (1 + (λ × BT / ρ) × ln(ε))
where λ is the wavelength of emitted radiance (~11 µm for Band 10), BT is brightness temperature, ρ = h·c/σ (a constant ≈ 1.438 × 10⁻² m·K), and ε is emissivity. This formula is standard in the literature and implemented in the GEE-based UHI web-app study (ResearchGate / ISPRS).
6. Visualise and classify Map LST with a diverging colour palette (cool blues to hot reds). Classify into zones, for Delhi NCR, I typically use five classes: <28°C, 28–32°C, 32–36°C, 36–40°C, >40°C, to make the output legible to non-specialist planners.
What Does Delhi NCR's LST Pattern Actually Look Like?
Research specifically examining Delhi using earth observation data confirms what the thermal maps show: the urban core consistently records higher surface temperatures than surrounding rural or green areas, a pattern that has intensified with urbanisation (Tandfonline, 2022). A micrometeorological and remote sensing assessment of Delhi's UHI found that the urban heat island effect is measurable across different land use and land cover categories within the megacity (Springer, 2012).
The Gurugram case, which is part of Delhi NCR, is instructive. A study covering 1990 to 2018 found that rapid population growth and land cover change made the area increasingly vulnerable to UHI, with urban areas experiencing higher mean temperatures than proximate rural zones (ISPRS Archives, 2019). Nearly three decades of data make this a strong baseline for understanding how the thermal landscape has shifted.
From a practical interpretation standpoint, the hottest pixels in a Delhi NCR LST map in May or June tend to cluster over:
- Dense commercial and industrial corridors (Noida, Faridabad industrial zones)
- Impervious surfaces with low albedo (major arterial roads, flyovers)
- Areas with minimal tree canopy cover
The coolest pixels, by contrast, consistently fall over the Yamuna floodplain, the Ridge forest, and irrigated agricultural land in the NCR periphery.
Connecting LST Analysis to UHI Quantification
Generating an LST map is the first step. Quantifying the UHI intensity requires a comparison. The Springer study on Delhi's UHI notes that using the lowest temperature within the city as a reference can be a good representation of urban heat island intensity (Springer, 2012). In GEE, this is straightforward: compute the mean LST for urban pixels (classified via LULC), compute the mean for rural/vegetated pixels in the same scene, and take the difference. That delta, often between 3°C and 8°C in Indian megacities during peak summer, is your UHI intensity metric.
The spatio-temporal dynamics approach used in the Kathmandu Valley UHI study, which combined remote sensing with predictive modelling, offers a useful methodological template for Indian cities too (ScienceDirect, 2025). Tracking LST change over multiple years (say, 2000, 2010, 2020, 2025) and correlating it with LULC transitions gives planners evidence for where greening or cool-roof interventions would have the greatest thermal impact.
Practical Takeaways for Indian Urban Planners and Researchers
- Use multi-date composites, not single scenes. A single cloud-free image may not represent typical conditions. Median composites over April–June reduce noise.
- Pair LST with NDVI and NDBI (Normalised Difference Built-up Index) to understand why certain zones are hotter, is it dense built-up area, bare soil, or low vegetation?
- Export results as GeoTIFF for use in QGIS or ArcGIS if stakeholders need offline access or integration with municipal GIS layers.
- Validate against station data where available. Palam, Safdarjung, and IMD AWS stations in Delhi can serve as ground-truth checkpoints for your LST retrievals.
- Communicate uncertainty - LST from Landsat reflects a 30 m pixel average and a specific overpass time (around 10:30 AM local for Landsat 8). Afternoon surface temperatures would be higher; your maps should carry that caveat.
Delhi's record pre-monsoon winds and heat are not isolated events. They are signals of a thermal environment that is changing faster than urban infrastructure is adapting. LST-based urban heat island mapping with Landsat in GEE gives researchers and planners a reproducible, low-cost tool to track that change and prioritise interventions, ward by ward, year by year.
Frequently asked questions
Which Landsat band is used to calculate land surface temperature for UHI mapping?
Landsat-8 and Landsat-9 carry Band 10, the thermal channel spanning 10.6-11.19 µm, as the primary input for deriving land surface temperature in urban heat island analysis.
What UHI intensity is typically measured in Indian megacities during summer?
UHI intensity, calculated as the difference between mean urban and mean rural/vegetated land surface temperature, often falls between 3°C and 8°C in Indian megacities during peak summer.
Why does Landsat's overpass time matter when interpreting LST maps?
Landsat 8 passes overhead around 10:30 AM local time, so its LST reflects that specific moment; afternoon surface temperatures would be higher, which is a caveat that should accompany any LST-based map.
What spatial resolution does Landsat thermal data offer for urban heat mapping?
Landsat-5 and Landsat-8 thermal infrared bands are available at 30 m spatial resolution, fine enough to distinguish a dense commercial block from a nearby park.
References
- Delhi Logs Strongest Winds in Over Two Decades - The Eastern Herald
- Land Surface Temperature as an Indicator of Urban Heat Island Effect - ResearchGate / ISPRS
- ISPRS Archives: GEE-Based Web-App for LST and UHI (2021)
- Use of Landsat-8 in GEE to Analyze Urban Heat - Citeus UM
- Analyzing LST with Google Earth Engine, AGSRT
- Spatio-temporal Dynamics of UHI, Kathmandu Valley - ScienceDirect (2025)
- Earth Observation Data in Monitoring UHI of Delhi - Tandfonline (2022)
- Assessment of UHI for Delhi - Springer (2012)
- Heat Island and Urbanization in Gurugram, Delhi NCR 1990–2018, ISPRS Archives (2019)
Researched and drafted with AI assistance.
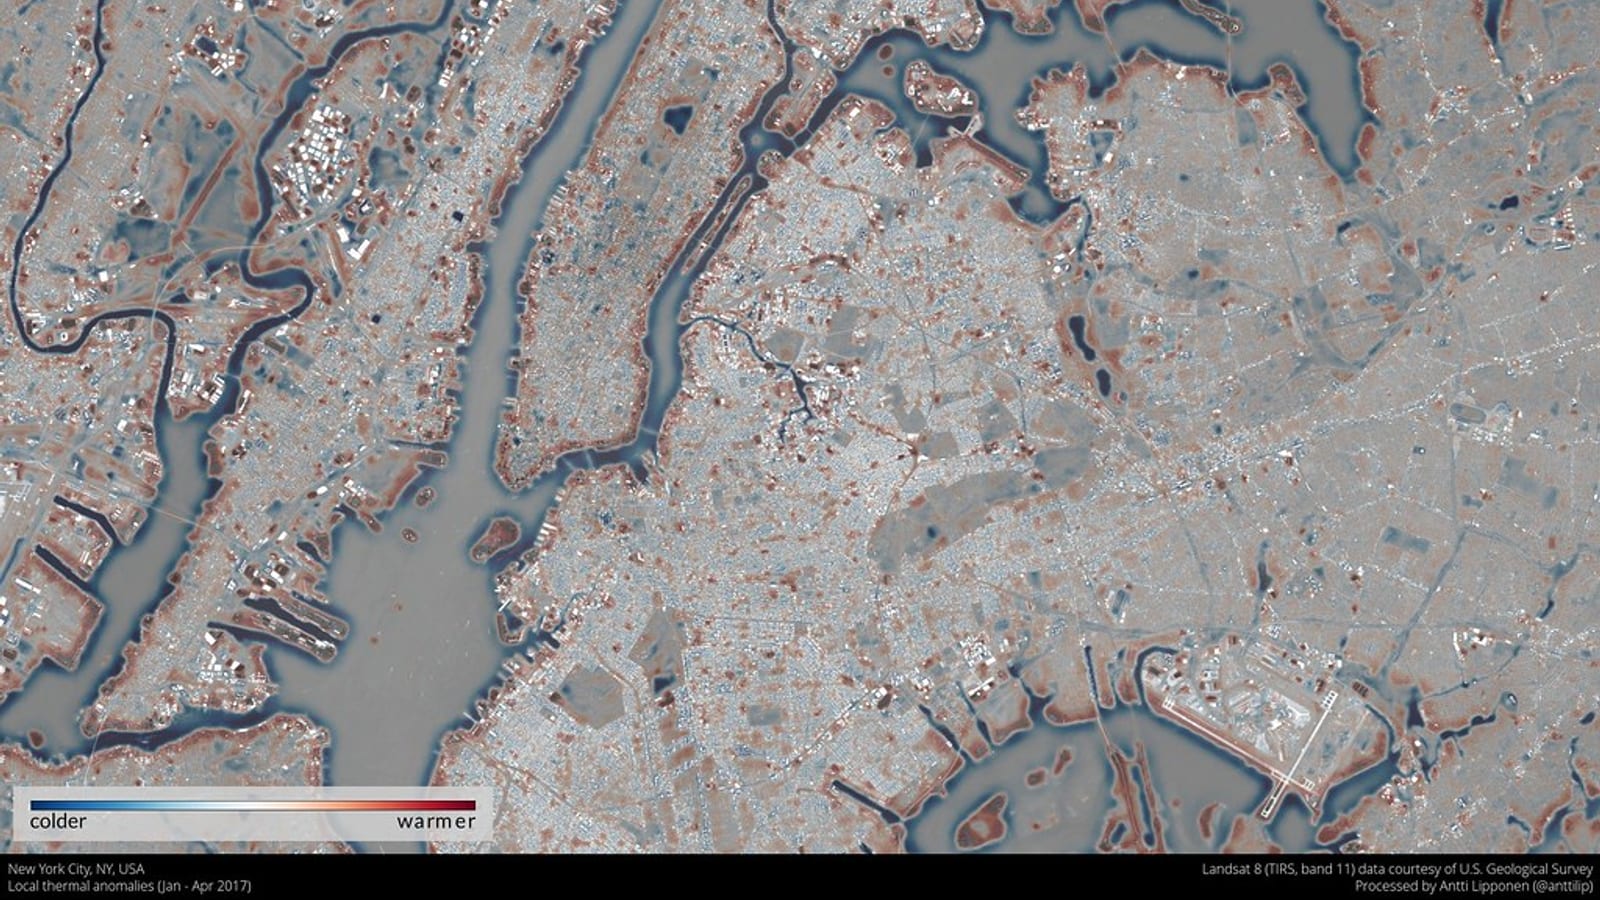
Hero image: "NYC local thermal anomalies Jan-Apr 2017" by anttilipponen is licensed under CC BY 2.0. To view a copy of this license, visit https://creativecommons.org/licenses/by/2.0/.