Use India’s Landslide Atlas for Road Screening in QGIS
A cautious QGIS workflow for using India’s national landslide inventory near Gangtok, with practical checks that keep a screening map from becoming a false risk map.
- Published
- Reading time
- 8 min
- Place
- Gangtok, Sikkim, India
- By
- Jannat Khosla
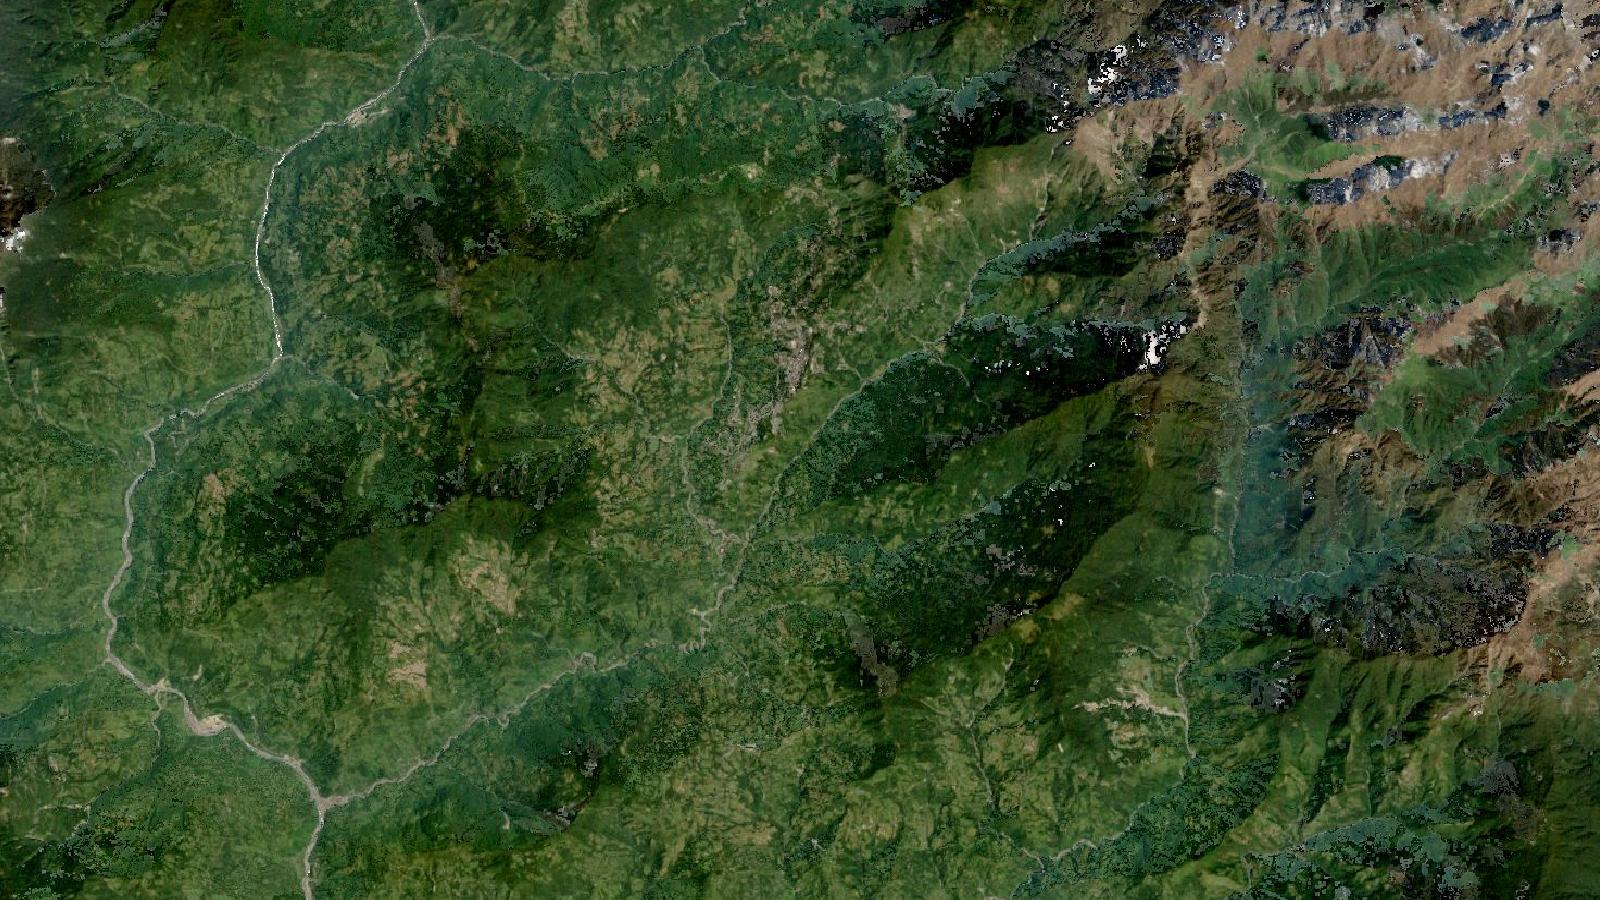
Cover: Landsat imagery of Gangtok, Sikkim, India, NASA (public domain).
An inventory is evidence, not a prediction
A landslide layer can make a map look decisive very quickly. Around Gangtok, where roads cross steep, altered slopes, that confidence is often misplaced. India’s Landslide Atlas records mapped landslide occurrences. It is valuable for finding places that deserve closer inspection, reviewing a road corridor, and adding context to a field plan. It does not say that an unmapped slope is safe, or that a mapped slope will fail in the next monsoon.
That distinction is more than careful wording. A buffer drawn around every mapped feature can turn a useful inventory into a misleading “risk map”. The professional task is to keep the dataset in its proper role: evidence of past mapped landslides, combined with present-day imagery, terrain, drainage, local knowledge and site inspection.
The National Remote Sensing Centre (NRSC) reports that its database contains about 80,000 landslides mapped by NRSC/ISRO under the Disaster Management Support programme during 1998 to 2022. It covers landslide-vulnerable areas in 17 states and 2 Union Territories across the Himalaya and Western Ghats. The inventory includes seasonal, event-based and route-wise records. NRSC’s atlas description also notes that mapping used high- and very-high-resolution satellite imagery, aerial images, and field validation for some mapped landslides.
Those details should shape the way you use the layer. This is a substantial national resource, but it is not a continuous live feed and it is not a complete record of every small failure. Cloud, vegetation, imagery availability, the timing of acquisition and the size of a feature all affect what can be mapped.
Keep the terminology straight
A landslide inventory tells you where landslides have been mapped and can carry spatial and temporal attributes. Susceptibility analysis estimates where future landslides may occur. Hazard analysis adds time and magnitude. Risk analysis considers expected impacts on people, roads, buildings or other exposed assets.
The Geological Survey of India makes these distinctions explicitly in its landslide guidance. It describes susceptibility as a spatial prediction of future occurrence, hazard as a prediction involving location, time and magnitude, and risk as an estimate of losses to elements at risk. GSI’s landslide hazard guidance also lists slope, lithology, structure, land cover, geomorphology and geohydrology among the factors considered in susceptibility work.
This matters when writing a map title. “Mapped landslides near a road corridor” is defensible. “Landslide risk along the road” is not, unless the project has undertaken the additional exposure, vulnerability and hazard work needed to support that claim.
Worked example: a desktop road screen near Gangtok
Imagine that a project team needs an early desktop review of a road corridor between Gangtok and a nearby hillside settlement. The aim is modest: identify stretches that merit field inspection before maintenance or improvement work is scoped. It is not to approve a design, set a building setback or issue a safety certificate.
Start by obtaining the atlas material from an official NRSC or ISRO source and reading the accompanying information before adding it to QGIS. The Landslide Atlas of India explains that the mapped database is held as GIS polygons with attributes relevant to landslide-disaster management. Preserve the original download and write down the source URL and access date in your project notes.
Add the inventory layer, the road centreline and any project boundary to QGIS. Open the inventory layer’s attribute table before symbolising it. Look for identifiers, mapping period, inventory type, event information and other fields supplied by the source. Do not rename a date-like field as “failure date” unless the documentation confirms that meaning. A mapping date, satellite-image date and event date are different things.
Set the project to a suitable projected coordinate reference system before measuring length or creating a review area. The inventory itself should retain its source coordinate reference system. QGIS can display layers with different coordinate systems together, but silently assigning a new CRS to a layer is not the same as reprojecting it.
Create a corridor review polygon around the road. Its width should be decided for the task at hand and recorded in the project notes. For a desktop screen, the polygon is a search area, not a safety zone. It is useful because it keeps the query and the resulting map focused on the corridor rather than making an entire district map harder to inspect.
Run Select by Location with the inventory as the source layer and the corridor review polygon as the comparison layer. Choose an appropriate spatial relationship, usually intersect for this use. QGIS documents that Select by Location creates a selection using the spatial relationship between features in two vector layers, including intersect, contain, overlap and within. The QGIS documentation is worth checking before choosing a predicate, because the wording changes the result.
Export the selected features to a GeoPackage rather than working on the national layer directly. Give the derivative layer an unambiguous name, such as gangtok_corridor_inventory_screen. Retain the original feature identifier and add fields called review_status, review_note, source_name and source_accessed.
Now add recent imagery that you are authorised to use and a DEM suitable for the scale of the question. Make a hillshade and place a partly transparent slope layer above it. These layers help you see gullies, ridges, road cuts and the relation between a mapped feature and the road. They are visual context, not an automated landslide model.
Review each selected feature at a useful display scale. Ask practical questions: is the mapped landslide uphill, downhill or across the road? Is there a visible drainage line entering a cut slope? Does current imagery show fresh exposed ground, a changed road alignment, retaining work or dense vegetation? Record what you can observe, and use unclear from imagery whenever the evidence does not support a confident interpretation.
The output should be a segment-by-segment review table or map. A segment can be marked field check recommended when it lies near mapped inventory evidence and also shows a current condition that needs examination. That is a useful operational result without pretending that GIS has completed a geotechnical assessment.
The costly beginner mistake
The common error is turning an occurrence map into a probability map. Analysts sometimes colour every inventory record red, add a broad buffer and label the result “high-risk area”. The styling is clear; the reasoning is not.
Past failure is relevant, especially because existing landslides are recognised warning locations in GSI guidance. Yet the conditions that matter at a site include slope material, drainage, road cuts, rainfall, land-cover change and the geometry of the possible runout. A mapped polygon does not supply all of them. Nor does a point symbol represent the full body, crown and runout path of a landslide.
Avoid the second half of the same mistake: treating a blank area as evidence of stability. The atlas documents mapped features for particular inventories and time periods. An absent feature could reflect no recognised occurrence, but it could also reflect limits in imagery, interpretation or coverage. Phrase negative findings carefully, for example: “No atlas feature was selected within the review area.” Do not write: “No landslide hazard exists.”
Checks before sharing the map
First, inspect the source geometry rather than relying on a centroid or a small point symbol. A road may run near the toe of a mapped polygon, cross its outer edge, or be on an unrelated adjacent slope. These situations carry different implications for field review.
Second, preserve time information. The NRSC atlas spans 1998 to 2022, and the seasonal, event-based and route-wise inventories do not all represent the same mapping circumstance. A road cut, drainage channel or settlement footprint may have changed substantially since the relevant observation. Current imagery helps identify change, but it does not replace a site visit where consequences are high.
Third, avoid false precision. A GIS measure can return a distance with decimal places even when the inventory geometry, image interpretation and road alignment do not support that degree of certainty. Report the result as a desktop screen and describe the evidence used.
Finally, make the derivative layer auditable. Include the official source, access date, project CRS, selection predicate, review-area method, imagery date where known and the analyst’s notes. Save the QGIS project alongside the GeoPackage. A colleague should be able to trace why a road segment was flagged without reconstructing your decisions from a screenshot.
Where this workflow fits
This approach is well suited to early reconnaissance, prioritising field visits, supporting a route-maintenance discussion and identifying where more detailed investigation should begin. It is unsuitable as the sole basis for engineering design, land-use approval, emergency warning or legal setback decisions.
The strongest part of the workflow is its restraint. India’s national inventory gives an analyst a consistent evidence layer across a wide region. QGIS makes it straightforward to subset that evidence to a project corridor. The value comes from clearly separating what the inventory records, what your desktop interpretation suggests, and what remains unknown until a qualified field or geotechnical assessment is done.
Frequently asked questions
Does a mapped landslide mean the slope will fail again?
No, it shows that a landslide was mapped at that location or nearby during the inventory period. Recurrence depends on site conditions such as geology, drainage, rainfall, slope modification and the nature of the original failure.
Can I use the Landslide Atlas for a building-permission decision?
No, use it as an initial evidence layer only. A permission decision needs the relevant authority’s process and may require a qualified site investigation that examines current slope condition, drainage and proposed construction.
Should I use one buffer distance for every mapped landslide?
No, a single buffer has no automatic physical meaning. For a desktop screen, document it as a review area. For a setback or design decision, follow applicable requirements and specialist geotechnical advice.
What should I keep when exporting the QGIS selection?
Keep original feature identifiers, source details, access date, inventory type or mapping-period fields, coordinate reference information and processing notes. These records allow another analyst to trace the derivative layer back to the official inventory.
References
- National Remote Sensing Centre, Landslide Atlas
- ISRO and NRSC, Landslide Atlas of India
- Geological Survey of India, Landslide Hazard
- QGIS documentation, Vector selection
Cover image: Landsat true-colour composite of Gangtok and Ranipool corridor (2000), NASA/USGS Landsat WELD via NASA GIBS (public domain).
Researched and drafted with AI assistance; sources are linked for verification.
Need this done for your own study area? Send me the area and what you need.
Cite this post
Khosla, J. (2026, November 2). Use India’s Landslide Atlas for Road Screening in QGIS. Jannat Khosla. https://jannatkhosla.com/blog/use-indias-landslide-atlas-for-road-screening-in-qgis
› BibTeX
@online{khosla2026indias,
  author = {Khosla, Jannat},
  title = {Use India’s Landslide Atlas for Road Screening in QGIS},
  date = {2026-11-02},
  url = {https://jannatkhosla.com/blog/use-indias-landslide-atlas-for-road-screening-in-qgis}
}